HOT TOPICS LIST
- MACD
- Fibonacci
- RSI
- Gann
- ADXR
- Stochastics
- Volume
- Triangles
- Futures
- Cycles
- Volatility
- ZIGZAG
- MESA
- Retracement
- Aroon
INDICATORS LIST
LIST OF TOPICS
PRINT THIS ARTICLE
by Andrew Hetherington
Manhattan Associates Incorporated (MANH) is at the end of the supply chain.
Position: N/A
Andrew Hetherington
Classic Dow Theorist who trades as a pure technician, using pattern recognition.
PRINT THIS ARTICLE
HEAD & SHOULDERS
Manhattan Associates Inc. at "Half Mast"
07/16/02 09:50:47 AMby Andrew Hetherington
Manhattan Associates Incorporated (MANH) is at the end of the supply chain.
Position: N/A
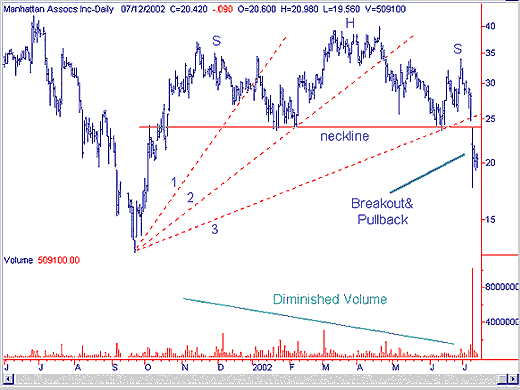
 Figure 1: Daily chart of Manhattan Associates Inc. Figure 1 shows a 9-month head and shoulders top reversal pattern on Manhattan Associates Incorporated (MANH). The volume diminishes from left to right as is required. The right shoulder is slightly abbreviated when you are looking for the symmetry that is common on the shoulders. Nonetheless, there is a strong breakout after the breaking of the third fan line. This breakout is on heavy volume and has formed an upside down half-mast flag. The third fan line break was in the $25.00 area to signal ID (Impending Doom). |
| This was a good opportunity to play this equity short while still within the pattern. Naturally, there is always an increased risk when trading within the pattern, but you must consider the percentages. While this half-mast flag is forming as the pullback, it is safe to assume that further downside is inevitable. I was hoping for a pullback on lighter volume than the breakout and a reaction up towards the $23.00-$24.00 area but this seems unlikely at this point. This equity is in serious trouble and will eventually see the $10.00 area. |

|
| Figure 2: Weekly chart of Manhattan Associates, Inc. |
| Graphic provided by: SuperCharts. |
| |
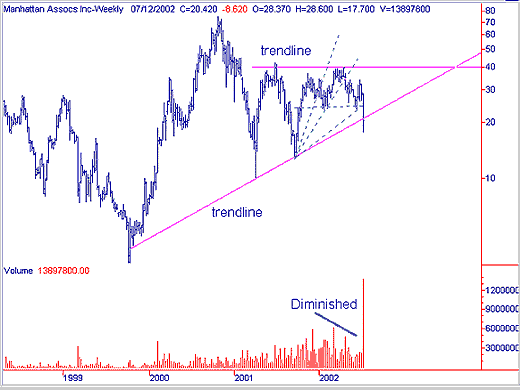
| The weekly chart shown in Figure 2 clearly illustrates the diminished volume on the head and shoulders pattern. This is the style of volume that I highly recommend for this type of pattern. If you follow the money trail you will make less errors. The slow draining of enthusiasm is easy to see on the weekly chart. Also, we have the long-term trend breaking in the $21.00 area. |
| Some traders follow moving averages, stochastic and candlesticks, using these types of indicators for their trading decisions. But this chart gives conflicting evidence, showing that you must be cautious when using them. For example, there was a bullish engulfing and two hammer candlesticks just prior to the recent hard drop. Secondly, right now most equities are well below all their moving averages, signalling an oversold condition. Lastly, the stochastic are reading very low as well indicating that a rise is likely. Naturally, this rise will not happen. These types of readings are common during a head and shoulders pattern and they will catch up to the pattern after a few days. Unfortunately, a few days later means they are trailing the pack and your stops will have kicked in if you were protecting your downside risk. |
Classic Dow Theorist who trades as a pure technician, using pattern recognition.
| Toronto, Canada |
Click here for more information about our publications!
Comments
Date: 07/16/02Rank: 3Comment:
Date: 07/16/02Rank: 5Comment:
Date: 08/17/02Rank: 4Comment:

Request Information From Our Sponsors
- StockCharts.com, Inc.
- Candle Patterns
- Candlestick Charting Explained
- Intermarket Technical Analysis
- John Murphy on Chart Analysis
- John Murphy's Chart Pattern Recognition
- John Murphy's Market Message
- MurphyExplainsMarketAnalysis-Intermarket Analysis
- MurphyExplainsMarketAnalysis-Visual Analysis
- StockCharts.com
- Technical Analysis of the Financial Markets
- The Visual Investor
- VectorVest, Inc.
- Executive Premier Workshop
- One-Day Options Course
- OptionsPro
- Retirement Income Workshop
- Sure-Fire Trading Systems (VectorVest, Inc.)
- Trading as a Business Workshop
- VectorVest 7 EOD
- VectorVest 7 RealTime/IntraDay
- VectorVest AutoTester
- VectorVest Educational Services
- VectorVest OnLine
- VectorVest Options Analyzer
- VectorVest ProGraphics v6.0
- VectorVest ProTrader 7
- VectorVest RealTime Derby Tool
- VectorVest Simulator
- VectorVest Variator
- VectorVest Watchdog
