HOT TOPICS LIST
- MACD
- Fibonacci
- RSI
- Gann
- ADXR
- Stochastics
- Volume
- Triangles
- Futures
- Cycles
- Volatility
- ZIGZAG
- MESA
- Retracement
- Aroon
INDICATORS LIST
LIST OF TOPICS
PRINT THIS ARTICLE
by Andrew Hetherington
Take advantage of the multiple chart pattern formations on American Expess (AXP).
Position: N/A
Andrew Hetherington
Classic Dow Theorist who trades as a pure technician, using pattern recognition.
PRINT THIS ARTICLE
CHART ANALYSIS
American Express ... Membership Has Its Rewards?
07/15/02 12:28:20 PMby Andrew Hetherington
Take advantage of the multiple chart pattern formations on American Expess (AXP).
Position: N/A

|
| Graphic provided by: SuperCharts. |
| |
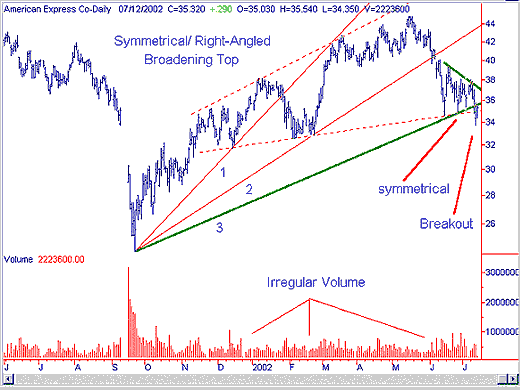
| This unusual pattern shown in the figure above is an 8-month symmetrical, right-angle broadening top. These are not a common pattern and many novice technicians confuse them with the more common broadening formation. The main difference between these two patterns is the volume piece of the puzzle. On the symmetrical, right-angle broadening top there will be irregular and unusually high volume on the creation of the pattern. Whereas, on the broadening formation the volume is the same as for any triangle or head and shoulders top pattern, meaning it diminishes throughout the pattern. |
| There are higher highs when the pattern is being formed and it looks similar to a head and shoulders pattern during the creation. However, if you see the volume side of the puzzle it will not diminish. I prefer head and shoulders patterns with spiking volume on the left shoulder that slowly diminish throughout the pattern so it is easy to distinguish the difference from broadening patterns. |
| In addition to the larger pattern, a small 1-month symmetrical triangle with diminished volume on the creation of the pattern is forming. Interestingly, the bottom line on the symmetrical triangle is also the third fan line and it gives a precursor of upcoming events. The small triangle and the third fan line breakout are in the $35.50 area. The breakout on the larger formation is in the $35.00 area. I anticipate a downward move to the $27.00 area eventually. The long-term 20-year trend is in the $16.00-$17.00 area and, unlike so many other Dow components, it isn't likely to reach that support line. |
Classic Dow Theorist who trades as a pure technician, using pattern recognition.
| Toronto, Canada |
Click here for more information about our publications!
Comments
Date: 07/16/02Rank: 5Comment:

|

Request Information From Our Sponsors
- StockCharts.com, Inc.
- Candle Patterns
- Candlestick Charting Explained
- Intermarket Technical Analysis
- John Murphy on Chart Analysis
- John Murphy's Chart Pattern Recognition
- John Murphy's Market Message
- MurphyExplainsMarketAnalysis-Intermarket Analysis
- MurphyExplainsMarketAnalysis-Visual Analysis
- StockCharts.com
- Technical Analysis of the Financial Markets
- The Visual Investor
- VectorVest, Inc.
- Executive Premier Workshop
- One-Day Options Course
- OptionsPro
- Retirement Income Workshop
- Sure-Fire Trading Systems (VectorVest, Inc.)
- Trading as a Business Workshop
- VectorVest 7 EOD
- VectorVest 7 RealTime/IntraDay
- VectorVest AutoTester
- VectorVest Educational Services
- VectorVest OnLine
- VectorVest Options Analyzer
- VectorVest ProGraphics v6.0
- VectorVest ProTrader 7
- VectorVest RealTime Derby Tool
- VectorVest Simulator
- VectorVest Variator
- VectorVest Watchdog
