HOT TOPICS LIST
- MACD
- Fibonacci
- RSI
- Gann
- ADXR
- Stochastics
- Volume
- Triangles
- Futures
- Cycles
- Volatility
- ZIGZAG
- MESA
- Retracement
- Aroon
INDICATORS LIST
LIST OF TOPICS
PRINT THIS ARTICLE
by Andrew Hetherington
International Paper Company (IP) has formed a similar pattern to many other Dow components and now this US paper and packaging behemoth is ready to drop.
Position: N/A
Andrew Hetherington
Classic Dow Theorist who trades as a pure technician, using pattern recognition.
PRINT THIS ARTICLE
CHART ANALYSIS
International Paper is Turning Into Pulp
07/11/02 01:30:36 PMby Andrew Hetherington
International Paper Company (IP) has formed a similar pattern to many other Dow components and now this US paper and packaging behemoth is ready to drop.
Position: N/A
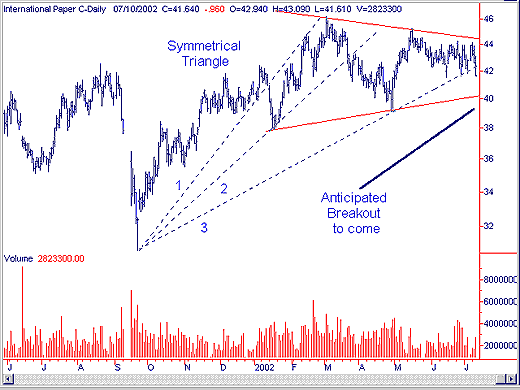
 Figure 1: Daily chart of International Paper. This 6-month symmetrical triangle with diminished looking volume from left to right is in the beginning stages of changing direction from up to down. This slow moving turtle may not have glamour but it certainly is dependable. My preference is to play this style of shorting opportunity off of the top triangle line in the $44.00 area. I try and anticipate the downward breaking of my third fan line, especially when the fan lines are so clearly defined. In this scenario, I can anticipate the breaking of the third fan line when you see the volumes spiking upwards with very little movement topside. If the general market conditions were good, then this style of volume would have helped for a topside breakout. What we have here is selling into strength. |
| This chart has given us an early warning of ID (Impending Doom) to come. The symmetrical triangle will break on the downside in the $40.00 area but it will likely take a short while--no longer than a few weeks to do so at most. The exact time for the upcoming break is difficult to prognosticate so some patience may be necessary. The technique that is customary here is for the third fan line to break and then there would be a small pullback to the fan line in the $42.00 area before resuming the inevitable down move through the bottom triangle line (neckline). A move back down towards the low $30.00 area is likely after the downside breakout. |

|
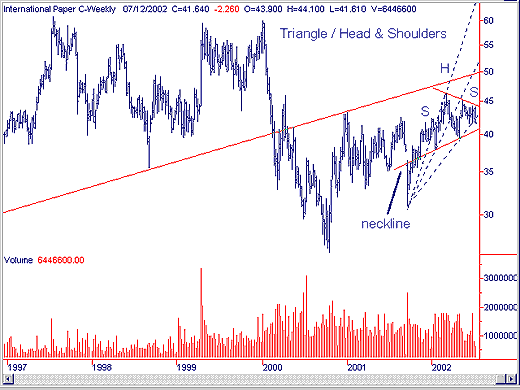
| Figure 2: Weekly chart of International Paper. |
| Graphic provided by: SuperCharts. |
| |
| On the weekly chart in Figure 2 we see that the symmetrical triangle could also be a 9-month head and shoulders top reversal pattern with an upsloping neckline. Both patterns exist within one another, as is often the case with head and shoulders patterns that are clearly defined. Either choice means down. |
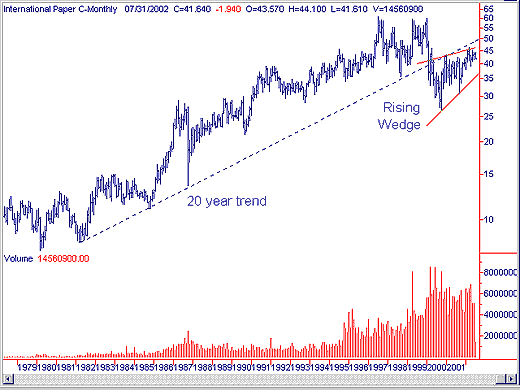
 Figure 3: Monthly chart of International Paper. Incidentally, the 20-year trend from 1982 was broken to the downside in February 2000 and it has yet to break topside of that resistance which is currently in the $50.00 area. It also has a much larger rising wedge or triangle, as seen on the monthly chart in Figure 3. This has bearish implications. |
Classic Dow Theorist who trades as a pure technician, using pattern recognition.
| Toronto, Canada |
Click here for more information about our publications!
Comments
Date: 07/13/02Rank: 5Comment:
Date: 07/14/02Rank: 3Comment: I would personally like to see info on insider trading, vol. accumulation, $ flow in the same article.
Date: 07/14/02Rank: 5Comment: I have a suggestion. Since gold is just starting a multi year bullmarket could you try to include more bullish analysis to establish long positions in gold stocks? Everybody knows everythings going in the crapper and that there is money to be made shorting. But some long analysis would be a refreshing bit of fresh air.

Request Information From Our Sponsors
- StockCharts.com, Inc.
- Candle Patterns
- Candlestick Charting Explained
- Intermarket Technical Analysis
- John Murphy on Chart Analysis
- John Murphy's Chart Pattern Recognition
- John Murphy's Market Message
- MurphyExplainsMarketAnalysis-Intermarket Analysis
- MurphyExplainsMarketAnalysis-Visual Analysis
- StockCharts.com
- Technical Analysis of the Financial Markets
- The Visual Investor
- VectorVest, Inc.
- Executive Premier Workshop
- One-Day Options Course
- OptionsPro
- Retirement Income Workshop
- Sure-Fire Trading Systems (VectorVest, Inc.)
- Trading as a Business Workshop
- VectorVest 7 EOD
- VectorVest 7 RealTime/IntraDay
- VectorVest AutoTester
- VectorVest Educational Services
- VectorVest OnLine
- VectorVest Options Analyzer
- VectorVest ProGraphics v6.0
- VectorVest ProTrader 7
- VectorVest RealTime Derby Tool
- VectorVest Simulator
- VectorVest Variator
- VectorVest Watchdog
