HOT TOPICS LIST
- MACD
- Fibonacci
- RSI
- Gann
- ADXR
- Stochastics
- Volume
- Triangles
- Futures
- Cycles
- Volatility
- ZIGZAG
- MESA
- Retracement
- Aroon
INDICATORS LIST
LIST OF TOPICS
PRINT THIS ARTICLE
by Andrew Hetherington
The best investment advice you will receive -- if a certain Prince is interested in buying long then you should be selling out your long position or shorting the equity!
Position: N/A
Andrew Hetherington
Classic Dow Theorist who trades as a pure technician, using pattern recognition.
PRINT THIS ARTICLE
CHART ANALYSIS
Symmetrical Triangle & Fan Lines: What happened to Citigroup?
07/11/02 01:28:53 PMby Andrew Hetherington
The best investment advice you will receive -- if a certain Prince is interested in buying long then you should be selling out your long position or shorting the equity!
Position: N/A
| I'm saying this facetiously, however there is a ring of truth to this notion. I recall this individual suggesting that he would always own Citigroup (C). This is a hard truth to face when you see a Dow component drop from $52.20 in January to the low $30.00 area when it's all done. |
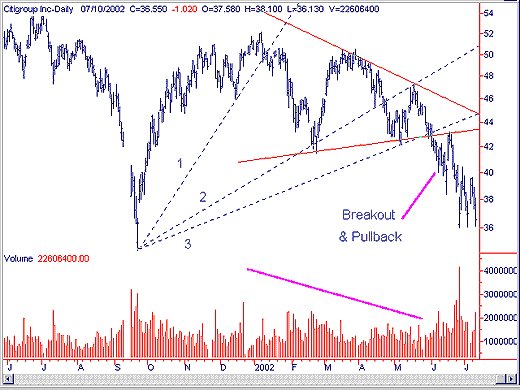
 Figure 1: Daily chart of Citigroup. Looking at the daily chart in Figure 1, we have a 5-month symmetrical triangle with diminished volume on the creation of the pattern. There is the usual pullback to the sell short position in the $43.00 area after the downside breakout. We have our dependable third fan line break to give confidence in taking a position on the pullback. The optimum time to buy back your short was on June 26, 2002. On this day there was a huge spike of 42 million shares and it closed above its opening. This signaled the temporary bottom was created. Although I think it will go lower to the low $30.00 area, this was a fast and easy profit and it should be banked when it happens. The options would have been very rewarding if taken on the pullback. |

|
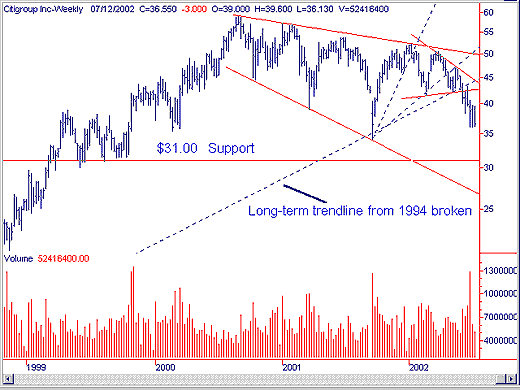
| Figure 2: Weekly chart of Citigroup. |
| Graphic provided by: SuperCharts. |
| |
| The weekly chart in Figure 2 shows our triangle with fan lines. The interesting piece of the puzzle is that the third fan line is also the long-term trendline from 1994. The breaking of this trend is significant. |
Classic Dow Theorist who trades as a pure technician, using pattern recognition.
| Toronto, Canada |
Click here for more information about our publications!
Comments
Date: 07/13/02Rank: 5Comment:

Request Information From Our Sponsors
- StockCharts.com, Inc.
- Candle Patterns
- Candlestick Charting Explained
- Intermarket Technical Analysis
- John Murphy on Chart Analysis
- John Murphy's Chart Pattern Recognition
- John Murphy's Market Message
- MurphyExplainsMarketAnalysis-Intermarket Analysis
- MurphyExplainsMarketAnalysis-Visual Analysis
- StockCharts.com
- Technical Analysis of the Financial Markets
- The Visual Investor
- VectorVest, Inc.
- Executive Premier Workshop
- One-Day Options Course
- OptionsPro
- Retirement Income Workshop
- Sure-Fire Trading Systems (VectorVest, Inc.)
- Trading as a Business Workshop
- VectorVest 7 EOD
- VectorVest 7 RealTime/IntraDay
- VectorVest AutoTester
- VectorVest Educational Services
- VectorVest OnLine
- VectorVest Options Analyzer
- VectorVest ProGraphics v6.0
- VectorVest ProTrader 7
- VectorVest RealTime Derby Tool
- VectorVest Simulator
- VectorVest Variator
- VectorVest Watchdog
