HOT TOPICS LIST
- MACD
- Fibonacci
- RSI
- Gann
- ADXR
- Stochastics
- Volume
- Triangles
- Futures
- Cycles
- Volatility
- ZIGZAG
- MESA
- Retracement
- Aroon
INDICATORS LIST
LIST OF TOPICS
PRINT THIS ARTICLE
by Andrew Hetherington
It has been a good ride up since April 2001. Now it is time for a breather for Procter and Gamble (PG).
Position: N/A
Andrew Hetherington
Classic Dow Theorist who trades as a pure technician, using pattern recognition.
PRINT THIS ARTICLE
BROADENING FORMATION
The Tide Has Turned for Procter & Gamble
07/08/02 09:31:44 AMby Andrew Hetherington
It has been a good ride up since April 2001. Now it is time for a breather for Procter and Gamble (PG).
Position: N/A
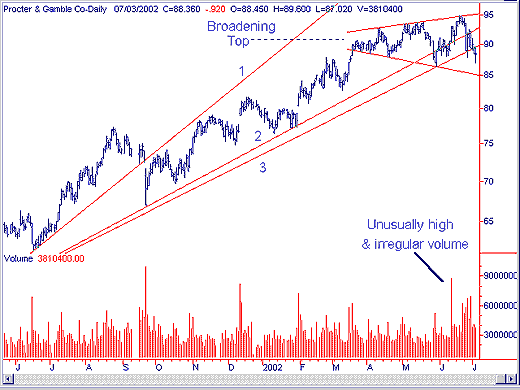
 Figure 1: Daily chart of Procter & Gamble. |
| The daily chart shows a broadening top. As previously discussed, this pattern occurs at the top of an uptrend. This reversal pattern has irregular and unusually high volume throughout the creation of the pattern. The volume characteristic separates the broadening top from other broadening formations. In other formation patterns the volume diminishes throughout the pattern, similar to that of a triangle. |

|
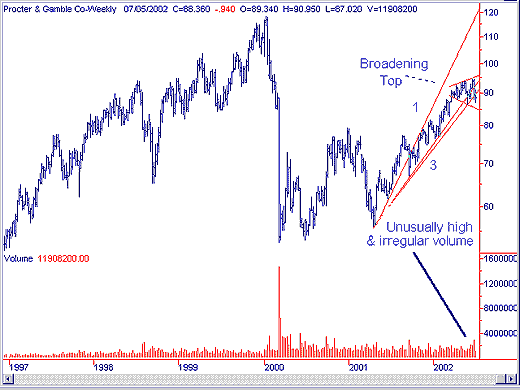
| Figure 2: Five-year chart of PG. |
| Graphic provided by: SuperCharts. |
| |
| This example has the required five points with the higher highs and lower lows in this 5-month broadening top. Anticipating the fifth point in the $95.00 area was a fairly safe bet as a shorting opportunity. In addition, there was also a third fan line break today in the $90.00 area. This confirmation of the ID (Impending Doom) to come gives the confidence necessary to ride out any short squeeze rallies. The bottom line on the pattern slopes downwards, and is currently in the $85.00 area for a breakout on the downside. Some will obviously disagree that this equity has fallen far enough already and there is little room left for a profitable shorting opportunity. However, the supports indicate a drop to the $75.00 - $80.00 area eventually, and maybe even lower, but $75.00-$80.00 is a safe wager. I normally prefer to trade these patterns off of the top line within the pattern, but there is more risk associated with this style of play. |
Classic Dow Theorist who trades as a pure technician, using pattern recognition.
| Toronto, Canada |
Click here for more information about our publications!
Comments
Date: 07/09/02Rank: 5Comment:
Date: 07/13/02Rank: 5Comment:

|

Request Information From Our Sponsors
- StockCharts.com, Inc.
- Candle Patterns
- Candlestick Charting Explained
- Intermarket Technical Analysis
- John Murphy on Chart Analysis
- John Murphy's Chart Pattern Recognition
- John Murphy's Market Message
- MurphyExplainsMarketAnalysis-Intermarket Analysis
- MurphyExplainsMarketAnalysis-Visual Analysis
- StockCharts.com
- Technical Analysis of the Financial Markets
- The Visual Investor
- VectorVest, Inc.
- Executive Premier Workshop
- One-Day Options Course
- OptionsPro
- Retirement Income Workshop
- Sure-Fire Trading Systems (VectorVest, Inc.)
- Trading as a Business Workshop
- VectorVest 7 EOD
- VectorVest 7 RealTime/IntraDay
- VectorVest AutoTester
- VectorVest Educational Services
- VectorVest OnLine
- VectorVest Options Analyzer
- VectorVest ProGraphics v6.0
- VectorVest ProTrader 7
- VectorVest RealTime Derby Tool
- VectorVest Simulator
- VectorVest Variator
- VectorVest Watchdog
