HOT TOPICS LIST
- MACD
- Fibonacci
- RSI
- Gann
- ADXR
- Stochastics
- Volume
- Triangles
- Futures
- Cycles
- Volatility
- ZIGZAG
- MESA
- Retracement
- Aroon
INDICATORS LIST
LIST OF TOPICS
PRINT THIS ARTICLE
by Andrew Hetherington
Even a less-than-perfect symmetrical triangle can be an indication of downward movement for Hewlett-Packard.
Position: N/A
Andrew Hetherington
Classic Dow Theorist who trades as a pure technician, using pattern recognition.
PRINT THIS ARTICLE
CHART ANALYSIS
Descending Triangle and Fan Lines: Hewlett-Packard Reboots
06/25/02 09:47:11 AMby Andrew Hetherington
Even a less-than-perfect symmetrical triangle can be an indication of downward movement for Hewlett-Packard.
Position: N/A

|
| Graphic provided by: SuperCharts. |
| |
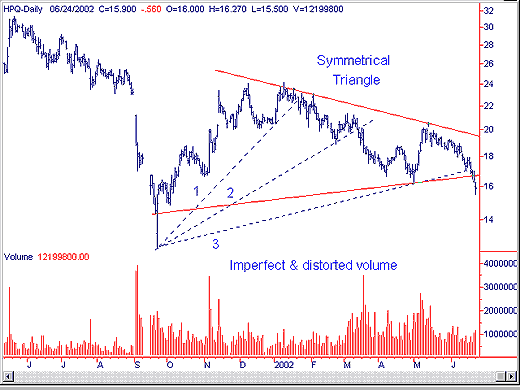
| This daily chart for Hewlett-Packard Company (HPQ) shows an 8-month symmetrical triangle with imperfect volume on the creation of the pattern. This imperfect volume is distorted for many reasons, not the least of which was the difficulty in the merger. Some will say this isn't a triangle since the volume doesn't confirm the pattern. However, there are times when you can sense the pattern distortion and must trust what you truly believe: I know this is a triangle. The tops and bottoms are clearly defined and it has the standard breaking of the third fan line. There is an increase in activity on the downside the past two trading days on the breaking of the lines. As I've explained previously, an increase on the downside is nice when it happens but it certainly is not a prerequisite for ID (impending doom). The doom and gloom comes unexpectedly on occasion and traders get caught with their pants down. In this scenario the worst is anticipated because volumes have increased. |
| The September low of $12.50 looks like it will be tested eventually. Currently, the pattern has broken down and may have a pullback to the line in the $16.75 area. If I were short on HPQ I would use a buy-stop just above the $16.75 line in the $17.45 area. This would allow a little play above my line of the triangle and the third fan line in the event it overshoots on the pullback. If I were long and had a short-term time horizon, I would bail out on the pullback to the line and buy back at a lower price to accumulate more shares. |
Classic Dow Theorist who trades as a pure technician, using pattern recognition.
| Toronto, Canada |
Click here for more information about our publications!
Comments
Date: 06/25/02Rank: 5Comment:
Date: 07/02/02Rank: 4Comment:
Date: 07/07/02Rank: 5Comment:

|

Request Information From Our Sponsors
- StockCharts.com, Inc.
- Candle Patterns
- Candlestick Charting Explained
- Intermarket Technical Analysis
- John Murphy on Chart Analysis
- John Murphy's Chart Pattern Recognition
- John Murphy's Market Message
- MurphyExplainsMarketAnalysis-Intermarket Analysis
- MurphyExplainsMarketAnalysis-Visual Analysis
- StockCharts.com
- Technical Analysis of the Financial Markets
- The Visual Investor
- VectorVest, Inc.
- Executive Premier Workshop
- One-Day Options Course
- OptionsPro
- Retirement Income Workshop
- Sure-Fire Trading Systems (VectorVest, Inc.)
- Trading as a Business Workshop
- VectorVest 7 EOD
- VectorVest 7 RealTime/IntraDay
- VectorVest AutoTester
- VectorVest Educational Services
- VectorVest OnLine
- VectorVest Options Analyzer
- VectorVest ProGraphics v6.0
- VectorVest ProTrader 7
- VectorVest RealTime Derby Tool
- VectorVest Simulator
- VectorVest Variator
- VectorVest Watchdog
