HOT TOPICS LIST
- MACD
- Fibonacci
- RSI
- Gann
- ADXR
- Stochastics
- Volume
- Triangles
- Futures
- Cycles
- Volatility
- ZIGZAG
- MESA
- Retracement
- Aroon
INDICATORS LIST
LIST OF TOPICS
PRINT THIS ARTICLE
by Andrew Hetherington
Although Dell Computer weathered the downturn in the technology industry better than most, the short-term outlook still looks weak.
Position: N/A
Andrew Hetherington
Classic Dow Theorist who trades as a pure technician, using pattern recognition.
PRINT THIS ARTICLE
CHART ANALYSIS
Rectangles and Fan Lines: Is Dell Computer in Trouble?
06/24/02 09:55:13 AMby Andrew Hetherington
Although Dell Computer weathered the downturn in the technology industry better than most, the short-term outlook still looks weak.
Position: N/A
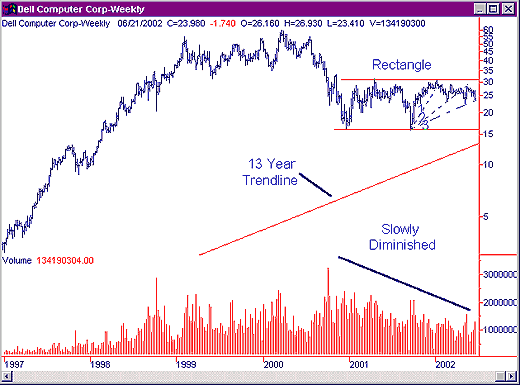
 Figure 1: Weekly chart of Dell Computer. The weekly chart for Dell Computer (DELL) shows that it wasn't hit nearly as hard as other technology equities. Although it has consolidated from $16.00 to $31.00 over the past year and a half, it has hung in there fairly well under difficult circumstances. The high of $59.68 in March of 2000 did not see a huge selloff as was evident in other technology equities throughout this same time frame. |
| Currently, we have an 18-month rectangle that has perfectly diminished volume on the creation of the pattern. I must caution those who prefer not to play within the pattern since this pattern has not broken out in either direction at this point. Those who like a little more risk will probably be rewarded on the short side in this chart in the near term. Also shown on the chart is a section of the 13-year trendline. Should Dell break below the rectangle, this trendline may become significant. |

|
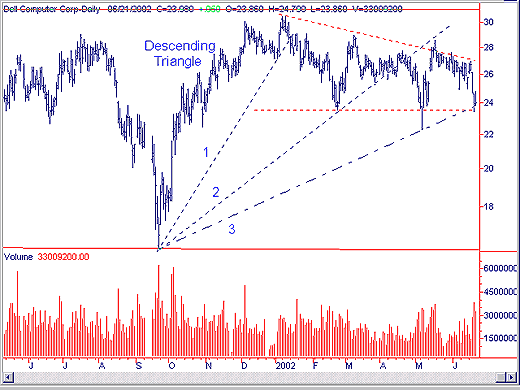
| Figure 2: Daily chart of Dell Computer. |
| Graphic provided by: SuperCharts. |
| |
| Looking at the daily chart we see a 6-month descending triangle with imperfect volume on the creation of the pattern. It certainly diminishes throughout the pattern but in the month of May there are a few higher volumes to make it imperfect. I've drawn my bottom line for a breakout in the $23.50 area and the top downward sloping line has a breakout in the $27.00 area. |
| Some might debate the placement of my top and bottom lines since it cuts off the top and bottom in May. The drawing of conservative lines is an important technique. The vindication for these lines will come when the downward move begins. We will know this when the initial drop starts and it quickly passes through the $23.50 area. A move down towards the $21.00 area seems inevitable when the triangle and third fan lines are broken. Eventually, we might even see a move down towards the bottom rectangle line at the $16.00 area. This is certainly a possibility given the short-term weakness. Whether or not the rectangle line holds in the $16.00 area is a guess at this time. However, if this large rectangle breaks on the downside it will be a move of significance. If I were long on Dell, I would sell given the short-term weakness and currently, I would sell it short off of the top triangle line or on the third fan line break to come. |
Classic Dow Theorist who trades as a pure technician, using pattern recognition.
| Toronto, Canada |
Click here for more information about our publications!
Comments
Date: 06/25/02Rank: 5Comment: Great work
Date: 06/25/02Rank: 5Comment:
Date: 07/02/02Rank: 5Comment:

|

Request Information From Our Sponsors
- StockCharts.com, Inc.
- Candle Patterns
- Candlestick Charting Explained
- Intermarket Technical Analysis
- John Murphy on Chart Analysis
- John Murphy's Chart Pattern Recognition
- John Murphy's Market Message
- MurphyExplainsMarketAnalysis-Intermarket Analysis
- MurphyExplainsMarketAnalysis-Visual Analysis
- StockCharts.com
- Technical Analysis of the Financial Markets
- The Visual Investor
- VectorVest, Inc.
- Executive Premier Workshop
- One-Day Options Course
- OptionsPro
- Retirement Income Workshop
- Sure-Fire Trading Systems (VectorVest, Inc.)
- Trading as a Business Workshop
- VectorVest 7 EOD
- VectorVest 7 RealTime/IntraDay
- VectorVest AutoTester
- VectorVest Educational Services
- VectorVest OnLine
- VectorVest Options Analyzer
- VectorVest ProGraphics v6.0
- VectorVest ProTrader 7
- VectorVest RealTime Derby Tool
- VectorVest Simulator
- VectorVest Variator
- VectorVest Watchdog
