HOT TOPICS LIST
- MACD
- Fibonacci
- RSI
- Gann
- ADXR
- Stochastics
- Volume
- Triangles
- Futures
- Cycles
- Volatility
- ZIGZAG
- MESA
- Retracement
- Aroon
INDICATORS LIST
LIST OF TOPICS
PRINT THIS ARTICLE
by Andrew Hetherington
In an earlier article at the end of February I discussed the rising wedge on Krispy Kreme Doughnuts (KKD). This big bearish pattern with the smaller head and shoulders pattern within has changed somewhat since that discussion, so I thought an update was necessary.
Position: N/A
Andrew Hetherington
Classic Dow Theorist who trades as a pure technician, using pattern recognition.
PRINT THIS ARTICLE
CHART ANALYSIS
Krispy Kreme Has Lost its Luster
06/14/02 10:19:57 AMby Andrew Hetherington
In an earlier article at the end of February I discussed the rising wedge on Krispy Kreme Doughnuts (KKD). This big bearish pattern with the smaller head and shoulders pattern within has changed somewhat since that discussion, so I thought an update was necessary.
Position: N/A
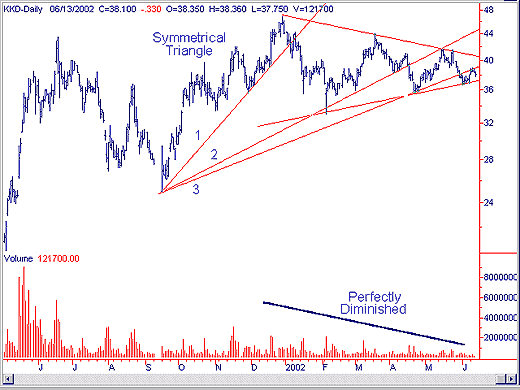
| Krispy Kreme is certainly still in trouble and I have adjusted my fan lines as is occasionally necessary when a pattern is developing. KKD has formed a symmetrical triangle in place of the head and shoulders pattern that I was anticipating. The volume on these patterns is the same, but a word of caution, since the pattern is not complete, the outcome is still in doubt. It was weak then but even weaker now. |
 Figure 1: Weekly chart of Krispy Kreme. The above chart shows a seven-month symmetrical triangle with excellent volume on the creation of the pattern. This pattern has not yet broken on the downside but it soon will. The volume has diminished and so has the investing public's fascination with this equity. In addition, the adjusted third fan line has now been broken and pulled back to the sell short position in the $39.00 area. The bottom line on the symmetrical triangle is in the $37.00 area, and when it breaks this line there will be confirmation of the downward direction. I suggest a buy stop just above the third fan line in the $39.25 area as a fail-safe measure. |

|
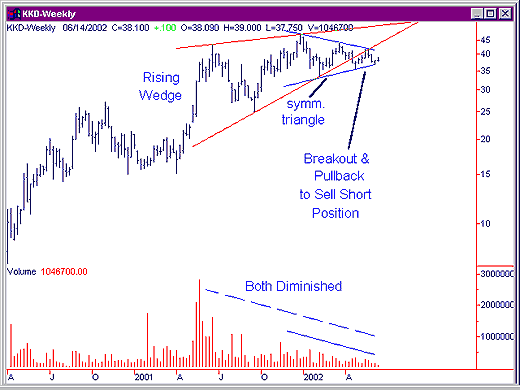
| Figure 2: Two-year weekly chart of KKD. |
| Graphic provided by: SuperCharts. |
| |
| The larger weekly chart in Figure 2 shows a one-year rising wedge pattern. This pattern is still intact as I discussed in February. In fact, there has been a downside breakout. KKD has currently pulled back to the sell short position. This confirmation on the much larger picture gives every indication of weakness. The smaller symmetrical triangle could go either way but, if you consider the larger wedge, the third fan line break, and that all other symmetrical triangles have broken on the downside then you have to take the downside. |
Classic Dow Theorist who trades as a pure technician, using pattern recognition.
| Toronto, Canada |
Click here for more information about our publications!
Comments
Date: 06/18/02Rank: 3Comment:
Date: 06/19/02Rank: 5Comment:
Date: 06/20/02Rank: 4Comment:
Date: 06/24/02Rank: 5Comment: very good call
Date: 06/25/02Rank: 5Comment:

Request Information From Our Sponsors
- StockCharts.com, Inc.
- Candle Patterns
- Candlestick Charting Explained
- Intermarket Technical Analysis
- John Murphy on Chart Analysis
- John Murphy's Chart Pattern Recognition
- John Murphy's Market Message
- MurphyExplainsMarketAnalysis-Intermarket Analysis
- MurphyExplainsMarketAnalysis-Visual Analysis
- StockCharts.com
- Technical Analysis of the Financial Markets
- The Visual Investor
- VectorVest, Inc.
- Executive Premier Workshop
- One-Day Options Course
- OptionsPro
- Retirement Income Workshop
- Sure-Fire Trading Systems (VectorVest, Inc.)
- Trading as a Business Workshop
- VectorVest 7 EOD
- VectorVest 7 RealTime/IntraDay
- VectorVest AutoTester
- VectorVest Educational Services
- VectorVest OnLine
- VectorVest Options Analyzer
- VectorVest ProGraphics v6.0
- VectorVest ProTrader 7
- VectorVest RealTime Derby Tool
- VectorVest Simulator
- VectorVest Variator
- VectorVest Watchdog
