

HOT TOPICS LIST
- MACD
- Fibonacci
- RSI
- Gann
- ADXR
- Stochastics
- Volume
- Triangles
- Futures
- Cycles
- Volatility
- ZIGZAG
- MESA
- Retracement
- Aroon
INDICATORS LIST
LIST OF TOPICS
PRINT THIS ARTICLE
by David Penn
"Summertime and the living is easy - fish are jumping and the cotton is high." Maybe not "high" yet, but if current trends hold, cotton traders may have reason to look up.
Position: N/A
David Penn
Technical Writer for Technical Analysis of STOCKS & COMMODITIES magazine, Working-Money.com, and Traders.com Advantage.
PRINT THIS ARTICLE
DOUBLE BOTTOMS
It's Bottoms Up in the Cotton Club
06/07/02 02:40:41 PMby David Penn
"Summertime and the living is easy - fish are jumping and the cotton is high." Maybe not "high" yet, but if current trends hold, cotton traders may have reason to look up.
Position: N/A
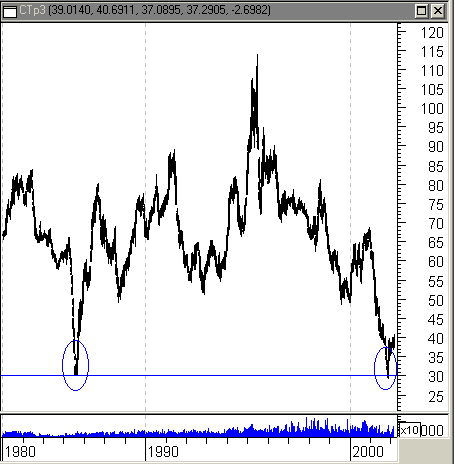 As the first chart showing the past 16 years of cotton futures illustrates, cotton futures are currently trading at historic lows. While this in and of itself does not mean that cotton prices are headed up, the extent of the secular depression in cotton prices suggests that a new cotton bull market is more likely than a resumption of the secular bear market that has taken cotton prices from a 1995 peak of $1.15 a pound to a 2001 low of 30 cents, a drop of 74% over six years. Aside from a volatile bull market from 1998 to late 2000, cotton, quite frankly, has been crashing. |
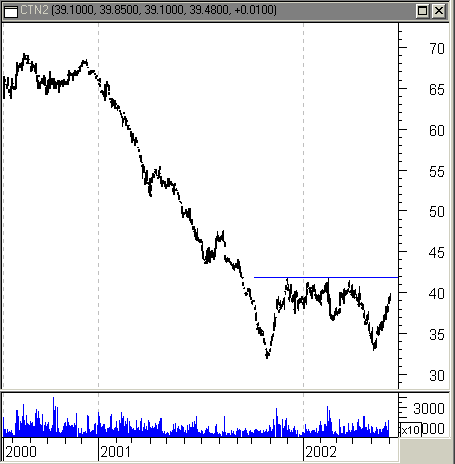
| A closer look at cotton futures, a look that takes into account only the last three years, does a good job of showing how sharp cotton's recent declines have been. Note, for example, that cotton prices were cut in half from the end of 2000 until cotton first bottomed late in 2001. Cotton rallied as 2001 ended, and entered a consolidation bottom between 42 and 33 cents before once again sharply correcting in the spring of 2002. Moving into the summer, cotton has rallied back up into the consolidation area, and now looks ready to take on resistance just north of 42 cents a pound. |
|
| Graphic provided by: MetaStock. |
| |
| I've pointed to a number of double bottom formations this spring-particularly in soybeans, sugar and the DJUA. Each of these formations has had a different resolution: after much fuss, soybeans did eventually move higher, and are now establishing new highs. Sugar's "double bottom" turned into more of a head and shoulders bottom. The double bottom in the DJUA featured a breakout that rose just over 6% before failing. What all these double bottoms had in common, however, was their relatively sharp "W"-like price action. In other words, the consolidation between the two bottoms that exists in the cotton double bottom did not exist in the soybean, sugar and DJUA double bottoms. |
| This consolidation, I suspect, is key. The sharp W-like double bottoms all had difficult breakouts (a point I raised in a follow-up Traders.com Advantage piece "Chart Pattern Failures" in late April), which may be due in part to the imperfect (or at least brief) bottoms each established. In other words, a W-bottom is really only two "V" bottoms right next to each other. And V-bottoms- in stocks as in economic recoveries- are not necessarily known for providing enduring upside. In the case of cotton shown here, regardless of the particular formation, cotton has established an eight-month range, roughly between 42 and 33 cents a pound, after a 50% drop. That, in and of itself, suggests that at least a bottom of some sort might be forming. Coupled with the fact that cotton is trading at a 16-year low, and the case for a bottom in cotton is all the more compelling. As far as a price target for the double bottom (considering the July contract), a formation size of about 10 and a "neckline" at 42 provides a minimum price target of 52. This is a significant level for cotton, as a number of previous declines (1988, 1991, 1992, 1993, 1999) all found support at or about 52. Thus it is probable that, reaching 52, cotton prices may encounter some measure of weak resistance. |
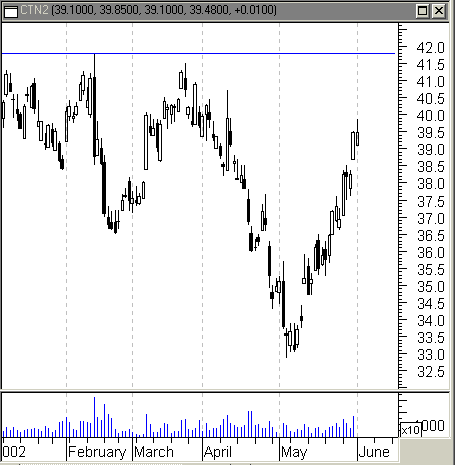 A year-to-date look at cotton, however, suggests that the road into the low 40s will not necessarily be an easy one. The second bottom of the double bottom begins with the April break, with prices reaching a low of 33 cents in early May. Since then, cotton has moved almost straight up, tacking on a little more than 21% in 18 days. Such a rise, combined with the "congestion" that begins once cotton rises into the high 30s, is likely not sustainable- at least not in one big swoosh. Those looking to get long cotton may want to look for signs of either a pullback (though to no lower than 37 cents, the correction low from February) or consolidation before hopping on. |
Technical Writer for Technical Analysis of STOCKS & COMMODITIES magazine, Working-Money.com, and Traders.com Advantage.
| Title: | Technical Writer |
| Company: | Technical Analysis, Inc. |
| Address: | 4757 California Avenue SW |
| Seattle, WA 98116 | |
| Phone # for sales: | 206 938 0570 |
| Fax: | 206 938 1307 |
| Website: | www.Traders.com |
| E-mail address: | DPenn@traders.com |
Traders' Resource Links | |
| Charting the Stock Market: The Wyckoff Method -- Books | |
| Working-Money.com -- Online Trading Services | |
| Traders.com Advantage -- Online Trading Services | |
| Technical Analysis of Stocks & Commodities -- Publications and Newsletters | |
| Working Money, at Working-Money.com -- Publications and Newsletters | |
| Traders.com Advantage -- Publications and Newsletters | |
| Professional Traders Starter Kit -- Software | |
Click here for more information about our publications!
Comments
Date:�06/09/02Rank:�3Comment:�

Request Information From Our Sponsors
- StockCharts.com, Inc.
- Candle Patterns
- Candlestick Charting Explained
- Intermarket Technical Analysis
- John Murphy on Chart Analysis
- John Murphy's Chart Pattern Recognition
- John Murphy's Market Message
- MurphyExplainsMarketAnalysis-Intermarket Analysis
- MurphyExplainsMarketAnalysis-Visual Analysis
- StockCharts.com
- Technical Analysis of the Financial Markets
- The Visual Investor
- VectorVest, Inc.
- Executive Premier Workshop
- One-Day Options Course
- OptionsPro
- Retirement Income Workshop
- Sure-Fire Trading Systems (VectorVest, Inc.)
- Trading as a Business Workshop
- VectorVest 7 EOD
- VectorVest 7 RealTime/IntraDay
- VectorVest AutoTester
- VectorVest Educational Services
- VectorVest OnLine
- VectorVest Options Analyzer
- VectorVest ProGraphics v6.0
- VectorVest ProTrader 7
- VectorVest RealTime Derby Tool
- VectorVest Simulator
- VectorVest Variator
- VectorVest Watchdog