HOT TOPICS LIST
- MACD
- Fibonacci
- RSI
- Gann
- ADXR
- Stochastics
- Volume
- Triangles
- Futures
- Cycles
- Volatility
- ZIGZAG
- MESA
- Retracement
- Aroon
INDICATORS LIST
LIST OF TOPICS
PRINT THIS ARTICLE
by Andrew Hetherington
The wireless age is upon us, however, we aren't there yet.
Position: N/A
Andrew Hetherington
Classic Dow Theorist who trades as a pure technician, using pattern recognition.
PRINT THIS ARTICLE
SYMMETRICAL TRIANGLE
Nextel Communications - The Wireless Evolution
06/04/02 09:42:04 AMby Andrew Hetherington
The wireless age is upon us, however, we aren't there yet.
Position: N/A
| We have wireless devices but are they as user-friendly and as inexpensive as we need them to be in order for their equities to rise to the top? Not yet. The sector still looks weak. My recent article on Palm illustrates the point. But the time has come for Nextel Communications (NXTL). |

|
| Graphic provided by: SuperCharts. |
| |
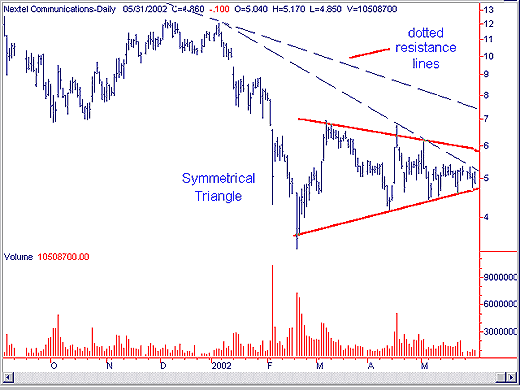
| There is a four to five month symmetrical triangle forming on Nextel's chart. The volume is perfect on the creation of this pattern, diminishing from left to right. We have no help from our dependable fan lines and there are no early warnings at this stage, but there are dotted blue resistance lines in the $5.15 and $7.40 areas. In addition, there is further resistance from the top triangle line in the $5.95 area that would be the breakout line for a topside breakout. The breakout on the downside of the triangle is in the $4.65 area. |
| The question remains- which way will it go? The general market condition is wobbly, but the QQQs have bottomed at $28.42. Most other symmetrical triangles have broken on the downside and the sector remains in trouble. It has not formed a bottom reversal pattern although it has formed a consolidation pattern. How do we know this? The fan lines usually created when the downtrend is reversing have not formed. The long-term trend is still intact and it is down. |
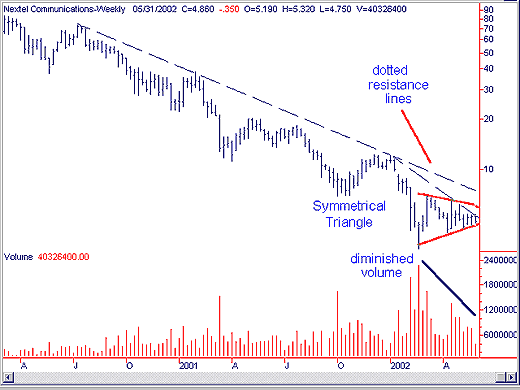
 The weekly chart clearly shows the long-term trend remains down even though we are at all time lows for this equity. It is still a percentage guess at this point but my money is on down. If I had recently purchased these shares thinking it would rebound sometime soon, I would bail out. Protecting against any downside potential should be your primary focus. If you prefer to take the risk by staying in, then I suggest a stop-loss under the bottom line in the $4.58 area. |
Classic Dow Theorist who trades as a pure technician, using pattern recognition.
| Toronto, Canada |
Click here for more information about our publications!
Comments
Date: 06/04/02Rank: 5Comment:

Request Information From Our Sponsors
- StockCharts.com, Inc.
- Candle Patterns
- Candlestick Charting Explained
- Intermarket Technical Analysis
- John Murphy on Chart Analysis
- John Murphy's Chart Pattern Recognition
- John Murphy's Market Message
- MurphyExplainsMarketAnalysis-Intermarket Analysis
- MurphyExplainsMarketAnalysis-Visual Analysis
- StockCharts.com
- Technical Analysis of the Financial Markets
- The Visual Investor
- VectorVest, Inc.
- Executive Premier Workshop
- One-Day Options Course
- OptionsPro
- Retirement Income Workshop
- Sure-Fire Trading Systems (VectorVest, Inc.)
- Trading as a Business Workshop
- VectorVest 7 EOD
- VectorVest 7 RealTime/IntraDay
- VectorVest AutoTester
- VectorVest Educational Services
- VectorVest OnLine
- VectorVest Options Analyzer
- VectorVest ProGraphics v6.0
- VectorVest ProTrader 7
- VectorVest RealTime Derby Tool
- VectorVest Simulator
- VectorVest Variator
- VectorVest Watchdog
