HOT TOPICS LIST
- MACD
- Fibonacci
- RSI
- Gann
- ADXR
- Stochastics
- Volume
- Triangles
- Futures
- Cycles
- Volatility
- ZIGZAG
- MESA
- Retracement
- Aroon
INDICATORS LIST
LIST OF TOPICS
PRINT THIS ARTICLE
by Andrew Hetherington
Amid a montage of chart patterns comes a breakout for Realnetworks.
Position: N/A
Andrew Hetherington
Classic Dow Theorist who trades as a pure technician, using pattern recognition.
PRINT THIS ARTICLE
CHART ANALYSIS
Triangles, a Pennant and Fan Lines, Realnetworks is Ready to Play
05/31/02 10:06:58 AMby Andrew Hetherington
Amid a montage of chart patterns comes a breakout for Realnetworks.
Position: N/A
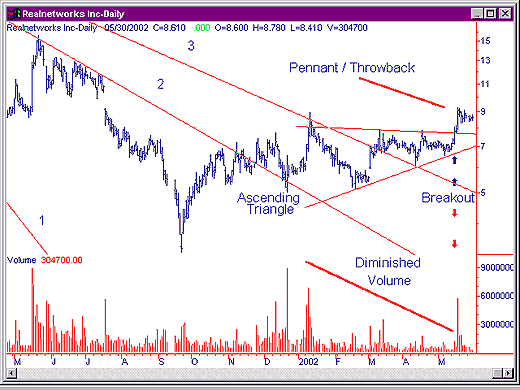
 The daily chart for Realnetworks (RNWK) shows a 5-month ascending/symmetrical triangle. The volume on this triangle diminished throughout the pattern and is well-formed. There is a breakout three quarters of the way through the pattern towards the apex on strong volume. This breakout had a small throwback that formed a pennant. This throwback is the appropriate time to take a long position. A case can also be made to call this a symmetrical triangle, depending on where you place your top line. This bottom reversal triangle is of sufficient size to have a considerable impact on the equity price. |
| There was an early warning on May 15, 2002 when the volume increased to 1.3 million shares and the equity went from $7.11 to $8.02 while closing at $7.70. Knowing that the third fan line had been broken with increased volume to change direction from down to up, along with the early warning, gave every indication of an up-move to follow. In addition, we also know the QQQ bottomed at $28.42, so overall market sentiment will be helpful as well. |

|
| Graphic provided by: SuperCharts. |
| |
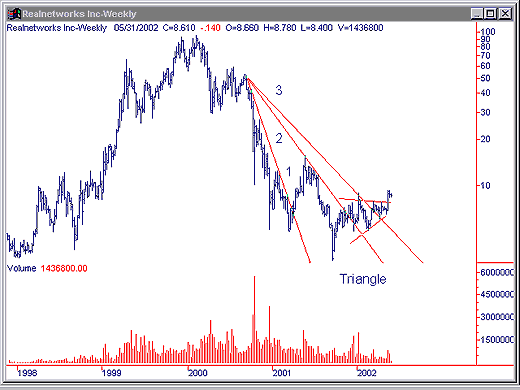
| On the weekly chart diminished volume on the pattern is easier to view, as are the fan lines. You can see how far down this equity has come so there is plenty of upside potential. A reminder is necessary since large drops in price are not always ready to reverse. You must wait for a reversal pattern to be completed before jumping in. The anticipated up-move is likely to be in the $12.00 - $12.80 area initially. |
Classic Dow Theorist who trades as a pure technician, using pattern recognition.
| Toronto, Canada |
Click here for more information about our publications!
Comments
Date: 06/01/02Rank: 5Comment:
Date: 06/01/02Rank: 5Comment:
Date: 06/02/02Rank: 3Comment:
Date: 06/03/02Rank: Comment: I m on the learning curve, so if you could clarify something I would appreciate it..Are you suggesting that the reversal won t be complete until the stock hit 12.00 or 12.80?
Date: 06/04/02Rank: 4Comment:

Request Information From Our Sponsors
- StockCharts.com, Inc.
- Candle Patterns
- Candlestick Charting Explained
- Intermarket Technical Analysis
- John Murphy on Chart Analysis
- John Murphy's Chart Pattern Recognition
- John Murphy's Market Message
- MurphyExplainsMarketAnalysis-Intermarket Analysis
- MurphyExplainsMarketAnalysis-Visual Analysis
- StockCharts.com
- Technical Analysis of the Financial Markets
- The Visual Investor
- VectorVest, Inc.
- Executive Premier Workshop
- One-Day Options Course
- OptionsPro
- Retirement Income Workshop
- Sure-Fire Trading Systems (VectorVest, Inc.)
- Trading as a Business Workshop
- VectorVest 7 EOD
- VectorVest 7 RealTime/IntraDay
- VectorVest AutoTester
- VectorVest Educational Services
- VectorVest OnLine
- VectorVest Options Analyzer
- VectorVest ProGraphics v6.0
- VectorVest ProTrader 7
- VectorVest RealTime Derby Tool
- VectorVest Simulator
- VectorVest Variator
- VectorVest Watchdog
