

HOT TOPICS LIST
- MACD
- Fibonacci
- RSI
- Gann
- ADXR
- Stochastics
- Volume
- Triangles
- Futures
- Cycles
- Volatility
- ZIGZAG
- MESA
- Retracement
- Aroon
INDICATORS LIST
LIST OF TOPICS
PRINT THIS ARTICLE
by Andrew Hetherington
A rush of volume should push Rational Software as well as several other equities into finishing their patterns.
Position: N/A
Andrew Hetherington
Classic Dow Theorist who trades as a pure technician, using pattern recognition.
PRINT THIS ARTICLE
HEAD & SHOULDERS
Rational Software Corp. is Head and Shoulders Above the Crowd!
05/28/02 11:05:18 AMby Andrew Hetherington
A rush of volume should push Rational Software as well as several other equities into finishing their patterns.
Position: N/A
| I've been looking for long positions since the QQQ hit $28.42. I've noticed that several equities are at the bottom of the right shoulder waiting for a rush of volume to push them significantly higher. These are large patterns and will probably take time to fulfill their destinies. To illustrate this point, see my previous article, "Patterns Within Patterns." In it, Network Appliances, Inc. (NTAP) formed a classic head and shoulders pattern. For those patterns currently forming, I must add a word of caution: These patterns have not broken out yet and the volume needs to increase significantly otherwise they may never be completed. |
|
| Graphic provided by: SuperCharts. |
| |
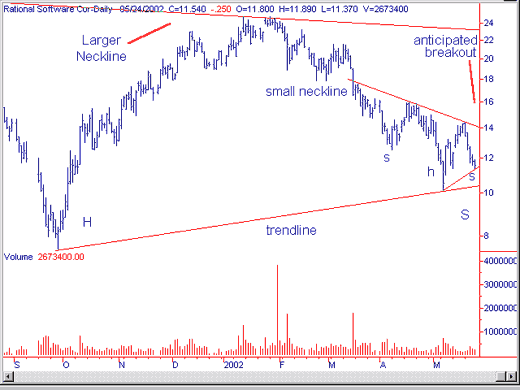
| On the daily chart for Rational Software Corporation (RATL) a small, three-month head and shoulders pattern is forming. It is in the process of finishing the bottom, right shoulder. The neckline is at the $14.00 area and it is waiting for the volume to increase. If the volume picks up and the price moves toward the neckline as I anticipate, then you should see a breakout. It is possible for the right shoulder to go slightly lower but at some point you have to decide to pick the bottom. If the bottom formed on Friday May 24, 2002 at $11.37 is not breached, then this bottom will most likely be completed. We will know for certain if we wait for our three-day away rule. Currently the volume on this pattern is satisfactory but not perfect. |
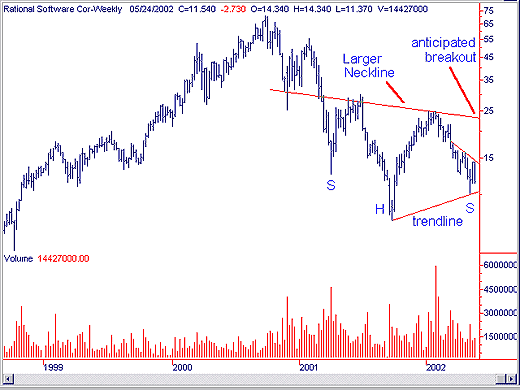 On the weekly chart you can see a much larger 14-month head and shoulders pattern. I've drawn the trendline across the bottoms to illustrate how closely this pattern resembles a triangle. The downsloping neckline has the breakout in the $23.50 area. The volume on the larger head and shoulders pattern is very good. It is slowly increasing throughout the pattern, starting from the base of the head. |
| If Lady Luck is shining on us we may be in a profitable position very soon. If not, my suggestion is for this to be a medium- to long-term hold to allow time for the pattern to complete. Trading off of a bottom reversal head and shoulders pattern is safest when you wait for the breakout. However, if the right shoulder looks like it is at or near the bottom, this strategy can be very profitable and protected in a short period of time allowing you to hold for a longer time frame. If you are near the bottom you can wait out the daily fluctuations and allow the equity to move significantly higher without the risk of losing your capital. |
Classic Dow Theorist who trades as a pure technician, using pattern recognition.
| Toronto, Canada |
Click here for more information about our publications!
Comments
Date:�05/29/02Rank:�4Comment:�
Date:�06/07/02Rank:�5Comment:�Can you please tell me briefly what the 3 Day away Rule is that is written in this article.
Yours Sincerely
Necip Olgac
necipolgac@veezy.com

Request Information From Our Sponsors
- StockCharts.com, Inc.
- Candle Patterns
- Candlestick Charting Explained
- Intermarket Technical Analysis
- John Murphy on Chart Analysis
- John Murphy's Chart Pattern Recognition
- John Murphy's Market Message
- MurphyExplainsMarketAnalysis-Intermarket Analysis
- MurphyExplainsMarketAnalysis-Visual Analysis
- StockCharts.com
- Technical Analysis of the Financial Markets
- The Visual Investor
- VectorVest, Inc.
- Executive Premier Workshop
- One-Day Options Course
- OptionsPro
- Retirement Income Workshop
- Sure-Fire Trading Systems (VectorVest, Inc.)
- Trading as a Business Workshop
- VectorVest 7 EOD
- VectorVest 7 RealTime/IntraDay
- VectorVest AutoTester
- VectorVest Educational Services
- VectorVest OnLine
- VectorVest Options Analyzer
- VectorVest ProGraphics v6.0
- VectorVest ProTrader 7
- VectorVest RealTime Derby Tool
- VectorVest Simulator
- VectorVest Variator
- VectorVest Watchdog