

HOT TOPICS LIST
- MACD
- Fibonacci
- RSI
- Gann
- ADXR
- Stochastics
- Volume
- Triangles
- Futures
- Cycles
- Volatility
- ZIGZAG
- MESA
- Retracement
- Aroon
INDICATORS LIST
LIST OF TOPICS
PRINT THIS ARTICLE
by Andrew Hetherington
The near-term future for Palm Incorporated (PALM) has become increasingly weak.
Position: N/A
Andrew Hetherington
Classic Dow Theorist who trades as a pure technician, using pattern recognition.
PRINT THIS ARTICLE
HEAD & SHOULDERS
Palm Inc. Has a Bleak Future
05/20/02 01:52:10 PMby Andrew Hetherington
The near-term future for Palm Incorporated (PALM) has become increasingly weak.
Position: N/A
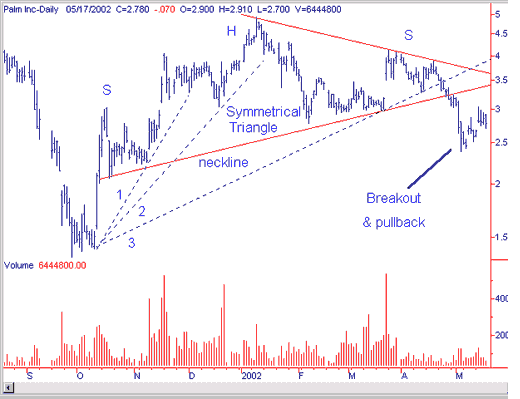
| Naturally, the wireless society we are all pining for is still in its infancy and unfortunately, equities like Palm reflect this idea. Long gone are the days when its IPO debuted in the $165.00 area. This was less than two years ago in March 2000. The high hopes remain but the equity price remains depressed and looking to go even lower. |
|
| Graphic provided by: SuperCharts. |
| |
| Beginning in October 2001, a 7-month head and shoulders pattern has formed. The pattern has higher volume in the beginning of the pattern that slowly diminishes throughout, which is the style of volume I prefer. This consolidation pattern has bounced off of the bottom from $1.35, reaching a high on the head at $4.94. There is an upsloping neckline, which had a breakdown on April 26, 2002 in the $3.30 area. The upsloping neckline is preferred when looking for a head and shoulders top. |
| There is a three-day stall, and then the volume picks up on the downside slide. April 23 provided the reason to exit all long positions when the third fan line was broken before the neckline break. This fan line was in the $3.50 area. The breakout went as low as $2.38 before pulling back to the sell short position of $3.03. This pullback began with an increase in volume and has tapered off as expected. This bear rally on lighter volume gives every indication of the fall to come. The initial stop will be the bottom of $2.38 and then below $2.00 to fulfill the destiny of the pattern. |
| In addition, many head and shoulder patterns have a tendency to look like triangles. I've labeled the symmetrical triangle to illustrate this point. The triangles come in various shapes depending on the neckline. If the neckline is horizontal, then a descending or ascending triangle is likely. |
Classic Dow Theorist who trades as a pure technician, using pattern recognition.
| Toronto, Canada |
Click here for more information about our publications!
Comments
Date:�05/22/02Rank:�4Comment:�
Date:�05/22/02Rank:�3Comment:�I have question on the H S in this chart. It looks to me that the shoulder that you have labled as the left shoulder is not the shoulder directly adjacent to the head. I mean if you are looking for an H S you would look for the shoulders to be adjacent to the head. This H S has what could be called two left shoulders stacked on top of each other. Why did you choose the shoulder at the bottom instead of the most obvious shoulder right next to the head? I would have never seen that because I look for the shoulders adjacent to the head.
Date:�05/28/02Rank:�5Comment:�
Date:�06/05/02Rank:�Comment:�How do you read Palm now that it has hit your target?
5/6/02

Request Information From Our Sponsors
- StockCharts.com, Inc.
- Candle Patterns
- Candlestick Charting Explained
- Intermarket Technical Analysis
- John Murphy on Chart Analysis
- John Murphy's Chart Pattern Recognition
- John Murphy's Market Message
- MurphyExplainsMarketAnalysis-Intermarket Analysis
- MurphyExplainsMarketAnalysis-Visual Analysis
- StockCharts.com
- Technical Analysis of the Financial Markets
- The Visual Investor
- VectorVest, Inc.
- Executive Premier Workshop
- One-Day Options Course
- OptionsPro
- Retirement Income Workshop
- Sure-Fire Trading Systems (VectorVest, Inc.)
- Trading as a Business Workshop
- VectorVest 7 EOD
- VectorVest 7 RealTime/IntraDay
- VectorVest AutoTester
- VectorVest Educational Services
- VectorVest OnLine
- VectorVest Options Analyzer
- VectorVest ProGraphics v6.0
- VectorVest ProTrader 7
- VectorVest RealTime Derby Tool
- VectorVest Simulator
- VectorVest Variator
- VectorVest Watchdog