HOT TOPICS LIST
- MACD
- Fibonacci
- RSI
- Gann
- ADXR
- Stochastics
- Volume
- Triangles
- Futures
- Cycles
- Volatility
- ZIGZAG
- MESA
- Retracement
- Aroon
INDICATORS LIST
LIST OF TOPICS
PRINT THIS ARTICLE
by Andrew Hetherington
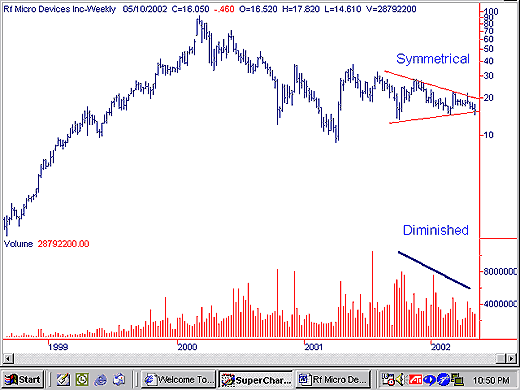
This 8-month symmetrical triangle on Rf Micro Devices Incorporated (RFMD) has everyone heading in the wrong direction.
Position: N/A
Andrew Hetherington
Classic Dow Theorist who trades as a pure technician, using pattern recognition.
PRINT THIS ARTICLE
SYMMETRICAL TRIANGLE
Rf Micro Devices' Triangle Formation Has Investors Guessing
05/14/02 10:49:36 AMby Andrew Hetherington
This 8-month symmetrical triangle on Rf Micro Devices Incorporated (RFMD) has everyone heading in the wrong direction.
Position: N/A
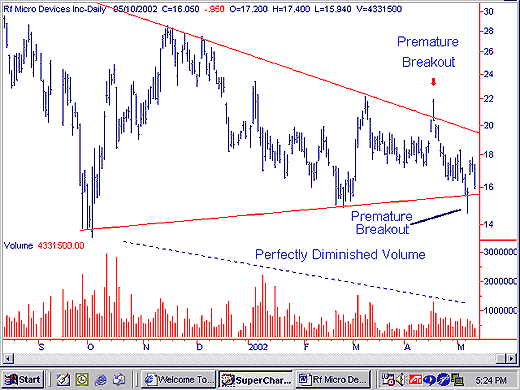
 RFMD's triangle has near-perfect volume on the creation of the pattern. It has been consolidating for nearly two years, and has recently had premature breakouts on the upside as well as the downside. The topside breakout that ran out of steam had good strong volume on the first two days to break above the intraday line. Unfortunately, it had a very weak close on the second day- at $20.35- the low for the day. In addition, the volume spiked on this day at 13.4 million shares. This spiking volume along with a very weak close was a warning that it didn't have the momentum to continue higher the next day. Over the next few days it dropped below $17.00. For the next 15 days it drifted lower towards the bottom line in the $15.60 area. On May 7 it had an intraday low of $14.61, below our breakout line of $15.60, but it closed above our line at $15.75, very near the high of the day at $15.99. On this occasion many were thinking it would be a good shorting opportunity and they are probably correct. However, we have a huge rally on the Nasdaq pulling everything upwards, including RFMD. Many probably bought back their short positions helping push the equity even higher. There was an element of short covering in the Nasdaq rally that contributed to this move towards $17.82. Those who were brave enough to ride out the rally will likely be rewarded with a downside break soon. Considering that most of these types of triangles have recently broken to the downside, this one is likely to follow that path as well. The bottom we are hoping for on the Nasdaq with our three-day away rule is still forming and we'll know in a few days if it moves away from its current bottom. If things remain a little uncertain, this one will become a victim. |
| The uncertainty throughout this chart, along with the premature breakouts in either direction, makes it difficult to decide which way to trade. My suggestion is to go with the prevailing trend until we are sure a bottom is in on the Nasdaq. |

|
| Graphic provided by: SuperCharts. |
| |
Classic Dow Theorist who trades as a pure technician, using pattern recognition.
| Toronto, Canada |
Click here for more information about our publications!
Comments
Date: 05/14/02Rank: 5Comment: GREAT ARTICLE !
Date: 05/15/02Rank: 3Comment:

Request Information From Our Sponsors
- StockCharts.com, Inc.
- Candle Patterns
- Candlestick Charting Explained
- Intermarket Technical Analysis
- John Murphy on Chart Analysis
- John Murphy's Chart Pattern Recognition
- John Murphy's Market Message
- MurphyExplainsMarketAnalysis-Intermarket Analysis
- MurphyExplainsMarketAnalysis-Visual Analysis
- StockCharts.com
- Technical Analysis of the Financial Markets
- The Visual Investor
- VectorVest, Inc.
- Executive Premier Workshop
- One-Day Options Course
- OptionsPro
- Retirement Income Workshop
- Sure-Fire Trading Systems (VectorVest, Inc.)
- Trading as a Business Workshop
- VectorVest 7 EOD
- VectorVest 7 RealTime/IntraDay
- VectorVest AutoTester
- VectorVest Educational Services
- VectorVest OnLine
- VectorVest Options Analyzer
- VectorVest ProGraphics v6.0
- VectorVest ProTrader 7
- VectorVest RealTime Derby Tool
- VectorVest Simulator
- VectorVest Variator
- VectorVest Watchdog
