HOT TOPICS LIST
- MACD
- Fibonacci
- RSI
- Gann
- ADXR
- Stochastics
- Volume
- Triangles
- Futures
- Cycles
- Volatility
- ZIGZAG
- MESA
- Retracement
- Aroon
INDICATORS LIST
LIST OF TOPICS
PRINT THIS ARTICLE
by Andrew Hetherington
Rising wedge formations tend to have bearish impications, and MCHP is in the process of finishing one.
Position: N/A
Andrew Hetherington
Classic Dow Theorist who trades as a pure technician, using pattern recognition.
PRINT THIS ARTICLE
WEDGE FORMATIONS
Microchip Technology (MCHP) - A Chart Filled With Caution
05/13/02 11:02:28 AMby Andrew Hetherington
Rising wedge formations tend to have bearish impications, and MCHP is in the process of finishing one.
Position: N/A
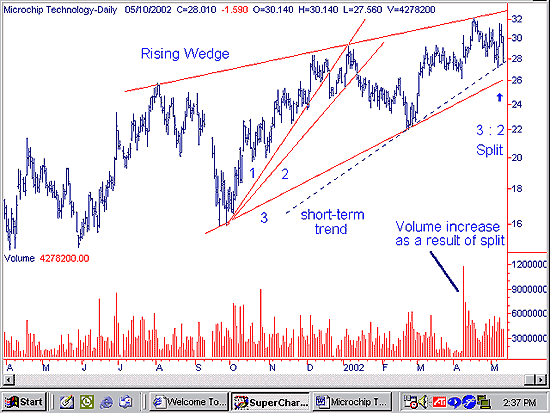
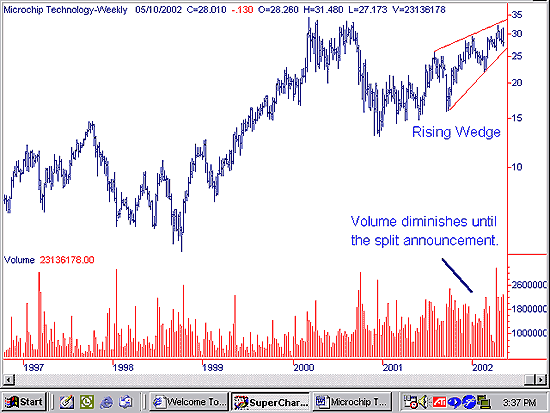
 Figure 1 shows an 11-month rising wedge forming on Microchip Technology (MCHP). This pattern requires diminished volume from left to right and must be accompanied with a break to the downside to be trusted. The top and bottom line slope upwards, converging in the distance. As with triangles, a breakout in the two-third to three-quarters area of the pattern is preferred. This pattern tends to have bearish implications. Of course, some will break topside, but by and large most will go south. There is a small short-term trendline, shown as the dotted blue line on the chart, to help piece the puzzle together. |
| When the dotted line is broken it will be time for a small down move. The question is whether or not the third fan line and bottom line on the wedge will hold in the $26.00 area. This is a very difficult situation since it could take a small breather and hold the line and then make new highs. You must then consider the general market conditions to determine if the market is long or short at the time the wedge is finishing. I would watch the volume when it nears the bottom line and hope for the increase in volume that is necessary for it to bounce upwards. My preference would be for days of six to eight million shares trading when approaching the line. If this doesn't happen I would be prepared with a stop-loss just under the bottom line in the $25.75 area. There has been an increase in activity since the 3 for 2 split was announced in April. Typically, equities rise after the split announcement and then drop a little after the split takes place. Considering the split situation, I'm discounting the increase in activity so the wedge still has diminished volume from my perspective. |

|
| Graphic provided by: SuperCharts. |
| |
| Let's assume that someone had purchased this equity in the $18.00 - $20.00 area in September or October. In addition, consider they have a medium-term time horizon. In this situation, I would sell if the very short-term trendline were broken since protecting your capital is important. There are plenty of other opportunities around every corner and this type of chart demands caution. Selling in this area limits your downside risk since the upside potential is in question. |
Classic Dow Theorist who trades as a pure technician, using pattern recognition.
| Toronto, Canada |
Click here for more information about our publications!
Comments
Date: 05/14/02Rank: 5Comment: EXCELLENT ARTICLE !!

Request Information From Our Sponsors
- StockCharts.com, Inc.
- Candle Patterns
- Candlestick Charting Explained
- Intermarket Technical Analysis
- John Murphy on Chart Analysis
- John Murphy's Chart Pattern Recognition
- John Murphy's Market Message
- MurphyExplainsMarketAnalysis-Intermarket Analysis
- MurphyExplainsMarketAnalysis-Visual Analysis
- StockCharts.com
- Technical Analysis of the Financial Markets
- The Visual Investor
- VectorVest, Inc.
- Executive Premier Workshop
- One-Day Options Course
- OptionsPro
- Retirement Income Workshop
- Sure-Fire Trading Systems (VectorVest, Inc.)
- Trading as a Business Workshop
- VectorVest 7 EOD
- VectorVest 7 RealTime/IntraDay
- VectorVest AutoTester
- VectorVest Educational Services
- VectorVest OnLine
- VectorVest Options Analyzer
- VectorVest ProGraphics v6.0
- VectorVest ProTrader 7
- VectorVest RealTime Derby Tool
- VectorVest Simulator
- VectorVest Variator
- VectorVest Watchdog
