HOT TOPICS LIST
- MACD
- Fibonacci
- RSI
- Gann
- ADXR
- Stochastics
- Volume
- Triangles
- Futures
- Cycles
- Volatility
- ZIGZAG
- MESA
- Retracement
- Aroon
INDICATORS LIST
LIST OF TOPICS
PRINT THIS ARTICLE
by Andrew Hetherington
The general market trend seems to be changing. Here's an example of how to take advantage of it.
Position: N/A
Andrew Hetherington
Classic Dow Theorist who trades as a pure technician, using pattern recognition.
PRINT THIS ARTICLE
TRIANGLES
Trading Tactics: What to Look For When Taking a Long Position
05/09/02 11:18:03 AMby Andrew Hetherington
The general market trend seems to be changing. Here's an example of how to take advantage of it.
Position: N/A
| The general market trend changed from down to up on Tuesday May 7, 2002. The QQQ's and the Nasdaq bottomed at the support levels of $28.42 and 1560 respectively. Volumes increased on all the indices, giving us a clue to the temporary bottom, most notably the Dow at 269 million shares and the Nasdaq at 2.1 billion shares traded. I say temporarily since you should have a wait-and-see approach over the next two to three days. This three day away rule is necessary while making tops and bottoms, but the huge rally on Wednesday was a good start. |
| The Nasdaq gapped up on Wednesday, and while this bottom is completing it may decide to fill in the gap. If this happens it will be a good opportunity to take a long position. This would normally happen over the next few days. If it continues up without filling in the gap it's prudent to wait for other opportunities. However, if you are a bit of a gambler and are looking for a good opportunity, try Electronic Artis Incorporated (ERTS). |

|
| Graphic provided by: SuperCharts. |
| |
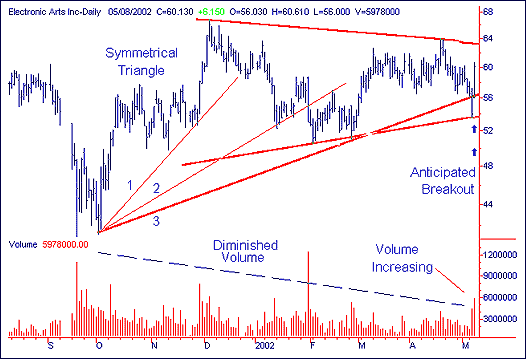
| Figure 1 shows a chart for ERTS. Depending on which line you prefer to start on, it is either a 5- or 7-month symmetrical triangle. I have no preference since the volume diminishes from left to right as is necessary for this style of pattern. |
| Naturally, I like the pattern and the increase in volume over the past two days. In addition, notice how the third fan line was breached but not broken on the downside. This pick-up in activity is often an early warning of things to come. If our prognosticating is correct we should see a continued increase in activity and upward movement in the price. The anticipated breakout is in the $63.00 area. I would use a stop-loss just below the third fan line- in the $55.40 area- just in case it goes in the wrong direction. Although most of these triangles have recently broken to the downside, the market conditions are a little more favorable for a topside break out. |
Classic Dow Theorist who trades as a pure technician, using pattern recognition.
| Toronto, Canada |
Click here for more information about our publications!
Comments
Date: 05/14/02Rank: 3Comment:
Date: 05/14/02Rank: 5Comment:

Request Information From Our Sponsors
- VectorVest, Inc.
- Executive Premier Workshop
- One-Day Options Course
- OptionsPro
- Retirement Income Workshop
- Sure-Fire Trading Systems (VectorVest, Inc.)
- Trading as a Business Workshop
- VectorVest 7 EOD
- VectorVest 7 RealTime/IntraDay
- VectorVest AutoTester
- VectorVest Educational Services
- VectorVest OnLine
- VectorVest Options Analyzer
- VectorVest ProGraphics v6.0
- VectorVest ProTrader 7
- VectorVest RealTime Derby Tool
- VectorVest Simulator
- VectorVest Variator
- VectorVest Watchdog
- StockCharts.com, Inc.
- Candle Patterns
- Candlestick Charting Explained
- Intermarket Technical Analysis
- John Murphy on Chart Analysis
- John Murphy's Chart Pattern Recognition
- John Murphy's Market Message
- MurphyExplainsMarketAnalysis-Intermarket Analysis
- MurphyExplainsMarketAnalysis-Visual Analysis
- StockCharts.com
- Technical Analysis of the Financial Markets
- The Visual Investor
