HOT TOPICS LIST
- MACD
- Fibonacci
- RSI
- Gann
- ADXR
- Stochastics
- Volume
- Triangles
- Futures
- Cycles
- Volatility
- ZIGZAG
- MESA
- Retracement
- Aroon
INDICATORS LIST
LIST OF TOPICS
PRINT THIS ARTICLE
by Andrew Hetherington
Over the past three months a nicely developed double top has formed for Boeing (BA).
Position: N/A
Andrew Hetherington
Classic Dow Theorist who trades as a pure technician, using pattern recognition.
PRINT THIS ARTICLE
DOUBLE TOPS
Boeing Takes a Dip
04/29/02 01:11:21 PMby Andrew Hetherington
Over the past three months a nicely developed double top has formed for Boeing (BA).
Position: N/A
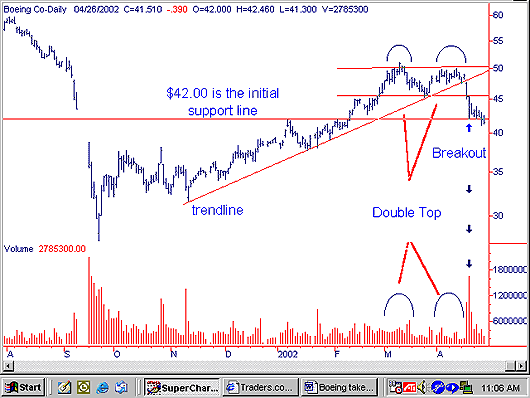
| The classic requirements for a douple top pattern are for the second top to form within a 3% range of the first top, a bottom completed at least 15% from the peaks on diminished volume, and the tops must be at least one month apart. There must be significantly higher volume on the first top compared to the second top. Then there must be a breakout to the downside, which need not be accompanied by higher volume. Your breakout line is a horizontal line across the bottom. This style of pattern is sometimes referred to as an " M " pattern since it looks like the letter M. The anticipated move on the downside is the distance between the top and the bottom line. |

|
| Figure 1: Daily chart for Boeing showing the formation of a double top. |
| Graphic provided by: SuperCharts. |
| |
| In the Boeing example above you want to know the correct time to trade this equity. When piecing the puzzle together it is important to take all chart information into consideration including the general trend of the market. There is less downside risk if you trade with the trend. Unfortunately, most professional and institutional traders aren't sure when a directional change will occur. How do we know this? At every turning point in the general trend you will see many equities increase the volume on the downside. This dumping into weakness is a sure sign that traders want to take any profit they have off the table or they want to minimize their losses. Also, consider any trendlines, third fan line breaks, and areas of support and resistance in order to determine entry or exit points. |
| In this chart you can see the 6-month trend was in jeopardy on April 17, 2002 when the line was broken in the $47.55 area. It would have been a better than average prognostication to say at that point a double top would be completed. This is well ahead of the breakout in the $45.50 area. There was dramatic spiking volume of 10.6 million shares, and it closed near the low of the bar. All this pointed to more downward pressure. The next trading day had even higher volume at 16.7 million shares and it touched our anticipated initial support level in the $42.00 area. This was the time to take your profits on this short since the pattern had fulfilled its destiny. Naturally, it could go lower over time but the close on this day was not near the low of the bar. The entire bar was between $45.38 and $41.99 with a close at $43.70. When it closes far off of the bottom of the bar and the volume is very high it is a safe assumption that it has temporarily bottomed and short positions need to be cashed out. Exiting your short positions on these hard drops is a safe style of play. |
Classic Dow Theorist who trades as a pure technician, using pattern recognition.
| Toronto, Canada |
Click here for more information about our publications!
Comments
Date: 05/02/02Rank: 5Comment: Excellent article, Andrew Hetherington has the best articles written on traders.com. I really learn alot everytime he writes something.
Date: 05/07/02Rank: 4Comment:

Request Information From Our Sponsors
- StockCharts.com, Inc.
- Candle Patterns
- Candlestick Charting Explained
- Intermarket Technical Analysis
- John Murphy on Chart Analysis
- John Murphy's Chart Pattern Recognition
- John Murphy's Market Message
- MurphyExplainsMarketAnalysis-Intermarket Analysis
- MurphyExplainsMarketAnalysis-Visual Analysis
- StockCharts.com
- Technical Analysis of the Financial Markets
- The Visual Investor
- VectorVest, Inc.
- Executive Premier Workshop
- One-Day Options Course
- OptionsPro
- Retirement Income Workshop
- Sure-Fire Trading Systems (VectorVest, Inc.)
- Trading as a Business Workshop
- VectorVest 7 EOD
- VectorVest 7 RealTime/IntraDay
- VectorVest AutoTester
- VectorVest Educational Services
- VectorVest OnLine
- VectorVest Options Analyzer
- VectorVest ProGraphics v6.0
- VectorVest ProTrader 7
- VectorVest RealTime Derby Tool
- VectorVest Simulator
- VectorVest Variator
- VectorVest Watchdog
