HOT TOPICS LIST
- MACD
- Fibonacci
- RSI
- Gann
- ADXR
- Stochastics
- Volume
- Triangles
- Futures
- Cycles
- Volatility
- ZIGZAG
- MESA
- Retracement
- Aroon
INDICATORS LIST
LIST OF TOPICS
PRINT THIS ARTICLE
by Andrew Hetherington
When to sell? It is the age-old question. There have been many explanations and theories. Try and keep it simple.
Position: N/A
Andrew Hetherington
Classic Dow Theorist who trades as a pure technician, using pattern recognition.
PRINT THIS ARTICLE
STRATEGIES
Trading Tactics - When to Sell?
04/04/02 09:09:58 AMby Andrew Hetherington
When to sell? It is the age-old question. There have been many explanations and theories. Try and keep it simple.
Position: N/A
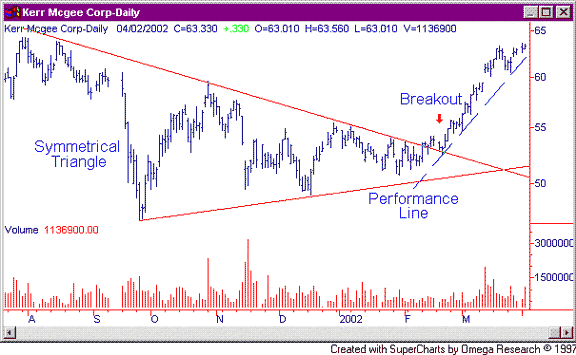
| Looking below in Figure 1, we have the daily chart on Kerr-McGee Corporation (KMG). |
| This chart has a nicely developed 5-month symmetrical triangle with very good volume on the creation of the pattern. The volume diminishes slowly from the beginning of the triangle to the breakout, rising on each top before diminishing once again. This slowly lowering volume throughout builds up the pressure within the pattern until it pops! In this example we see a delayed reaction to the breakout from the volume perspective. The higher volume does not show up until three weeks afterwards. |

|
| Figure 1: Daily chart for KMG. |
| Graphic provided by: SuperCharts. |
| |
| It would have been easy to be fooled on this breakout since there was no volume confirmation. Once the volume rushes in we want to know if the party is over in the near term and if we should take some profits. My suggestion is to always watch the volume closely along with my performance line (I have made reference to this performance line in previous articles, such as Philip Morris Has Safety and Growth Potential., which I draw across the very short-term bottoms. Normally, these types of breakouts from congestion areas form trend channels. These channels are fairly predictable. If you are a short-term speculator or a nervous investor the appropriate time to sell is when this channel is broken. Naturally, if it is a big pattern you may want to enter a long position once again when it throws back a little towards the cradle. If it doesn't throw back far enough into the cradle then I would look for other opportunities since the downside risk would be too high. It's my preference to play close to the lines to limit the downside potential. Minimizing losses and good money management are important elements in all investing. |
| Watching this performance line is one way to help let your winners run while protecting your profits. Many talk about allowing the winners to run but how many really know when to sell. The first day of lower volume with lower highs may not always be the best time to sell your long position. There is a natural ebb and flow in equities that must be adhered to and the performance line helps take away some of the guesswork. |
Classic Dow Theorist who trades as a pure technician, using pattern recognition.
| Toronto, Canada |
Click here for more information about our publications!
Comments
Date: 04/05/02Rank: 4Comment:
Date: 04/09/02Rank: 1Comment:

Request Information From Our Sponsors
- StockCharts.com, Inc.
- Candle Patterns
- Candlestick Charting Explained
- Intermarket Technical Analysis
- John Murphy on Chart Analysis
- John Murphy's Chart Pattern Recognition
- John Murphy's Market Message
- MurphyExplainsMarketAnalysis-Intermarket Analysis
- MurphyExplainsMarketAnalysis-Visual Analysis
- StockCharts.com
- Technical Analysis of the Financial Markets
- The Visual Investor
- VectorVest, Inc.
- Executive Premier Workshop
- One-Day Options Course
- OptionsPro
- Retirement Income Workshop
- Sure-Fire Trading Systems (VectorVest, Inc.)
- Trading as a Business Workshop
- VectorVest 7 EOD
- VectorVest 7 RealTime/IntraDay
- VectorVest AutoTester
- VectorVest Educational Services
- VectorVest OnLine
- VectorVest Options Analyzer
- VectorVest ProGraphics v6.0
- VectorVest ProTrader 7
- VectorVest RealTime Derby Tool
- VectorVest Simulator
- VectorVest Variator
- VectorVest Watchdog
