HOT TOPICS LIST
- MACD
- Fibonacci
- RSI
- Gann
- ADXR
- Stochastics
- Volume
- Triangles
- Futures
- Cycles
- Volatility
- ZIGZAG
- MESA
- Retracement
- Aroon
INDICATORS LIST
LIST OF TOPICS
PRINT THIS ARTICLE
by Andrew Hetherington
Where can I safely put my money to work and receive a reasonable rate of return? The answer is in Philip Morris (MO). Naturally, there are some negatives attached to this equity, but it's a very strong chart. If you are able to focus on the medium to long-term time horizon, then this is for you!
Position: N/A
Andrew Hetherington
Classic Dow Theorist who trades as a pure technician, using pattern recognition.
PRINT THIS ARTICLE
TECHNICAL ANALYSIS
Philip Morris Has Safety and Growth Potential
02/13/02 03:21:39 PMby Andrew Hetherington
Where can I safely put my money to work and receive a reasonable rate of return? The answer is in Philip Morris (MO). Naturally, there are some negatives attached to this equity, but it's a very strong chart. If you are able to focus on the medium to long-term time horizon, then this is for you!
Position: N/A
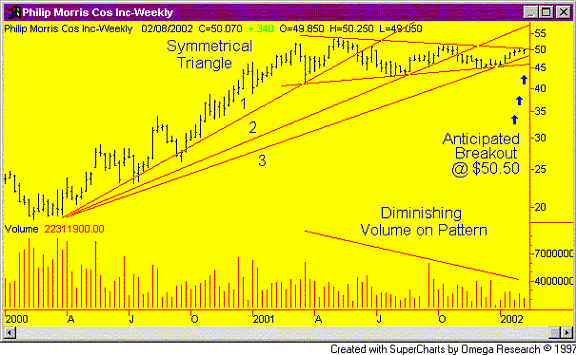
| Looking at the weekly chart of Philip Morris we see a 1-year symmetrical triangle with good volume on its creation. This pattern requires diminished volume during its formation, and although the volume isn't perfect, it is fairly decent. The breakout at $50.50 has not come yet so I caution all who are faint of heart to wait for the breakout to confirm the pattern. It has always been my thought to try and anticipate the move thus maximizing on the profit potential with the increased risk. However, those using their 401K and RSP money might want to wait for the confirmation. |
| There is reason to jump in early since the downside is limited to the $48.00 fan line. I expect the third fan line to hold, supporting the price. If I'm wrong, the bottom line on the triangle will likely hold at the $46.00 area since there would be plenty of buying demand in this range. Of course, if the $46.00 line breaks you must sell out of your position with a stop-loss at $45.45. |

|
| Figure 1: Weekly chart for MO |
| Graphic provided by: SuperCharts. |
| |
| On the other hand if I am correct and the price starts to move, then use the two bottoms, which create my third fan line, as a gauge of performance. Draw a line across the two bottoms from March 31, 2000 to the next bottom on Jan. 4, 2002. If this line is breached then bail out and lock in your profits. This performance line is geared toward those not looking for a regular income from their holdings. If you are looking at this as an income supplement then take the entire chart into consideration. If the income is good and the chart hasn't weakened significantly over the long term then there would be no reason to sell. |
| Confirmation will come when we see a strong move above $50.50 to at least the $52.00 area on 10 million or more shares on a single day. I expect that the move will be more of a gradual nature but there should be a steady cumulative increase in the volume during this breakout. |
| My expectations are for this buy in point to be very well protected down the road and if you hang in there for the longer term (1-5 years) you will probably be around for the next split. The last split came in April of 1997. In addition to the growth in the stock price you will also receive the dividends. This is of particular interest to those on fixed incomes, as Phillip Morris seems to increase their dividends for a couple of years leading up to the splits. So I expect the dividend will continue to rise over this period. Who says you can't have safety and growth! |
Classic Dow Theorist who trades as a pure technician, using pattern recognition.
| Toronto, Canada |
Click here for more information about our publications!
PRINT THIS ARTICLE

Request Information From Our Sponsors
- VectorVest, Inc.
- Executive Premier Workshop
- One-Day Options Course
- OptionsPro
- Retirement Income Workshop
- Sure-Fire Trading Systems (VectorVest, Inc.)
- Trading as a Business Workshop
- VectorVest 7 EOD
- VectorVest 7 RealTime/IntraDay
- VectorVest AutoTester
- VectorVest Educational Services
- VectorVest OnLine
- VectorVest Options Analyzer
- VectorVest ProGraphics v6.0
- VectorVest ProTrader 7
- VectorVest RealTime Derby Tool
- VectorVest Simulator
- VectorVest Variator
- VectorVest Watchdog
- StockCharts.com, Inc.
- Candle Patterns
- Candlestick Charting Explained
- Intermarket Technical Analysis
- John Murphy on Chart Analysis
- John Murphy's Chart Pattern Recognition
- John Murphy's Market Message
- MurphyExplainsMarketAnalysis-Intermarket Analysis
- MurphyExplainsMarketAnalysis-Visual Analysis
- StockCharts.com
- Technical Analysis of the Financial Markets
- The Visual Investor
