HOT TOPICS LIST
- MACD
- Fibonacci
- RSI
- Gann
- ADXR
- Stochastics
- Volume
- Triangles
- Futures
- Cycles
- Volatility
- ZIGZAG
- MESA
- Retracement
- Aroon
INDICATORS LIST
LIST OF TOPICS
PRINT THIS ARTICLE
by Andrew Hetherington
Applied Micro Circuits Corporation is either a good long opportunity with very limited downside risk or it will become a nice short if it breaks the $7.85 line.
Position: N/A
Andrew Hetherington
Classic Dow Theorist who trades as a pure technician, using pattern recognition.
PRINT THIS ARTICLE
SYMMETRICAL TRIANGLE
Symmetrical Triangle
03/25/02 11:23:08 AMby Andrew Hetherington
Applied Micro Circuits Corporation is either a good long opportunity with very limited downside risk or it will become a nice short if it breaks the $7.85 line.
Position: N/A
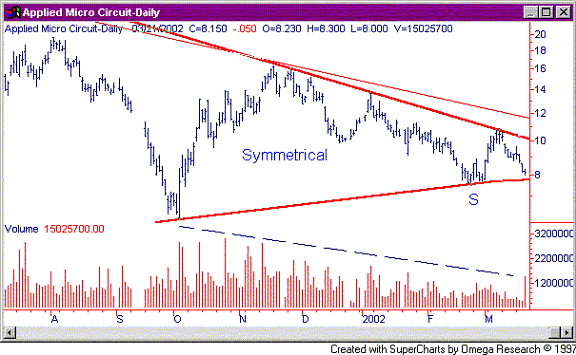
| AMCC has a very interesting six-month symmetrical triangle, which is almost completed. |
| Looking at the bottom of Figure 1, you can see the slowly diminishing volume accompaning this style of pattern. The top line breakout is in the $10.00 area and the downside break is at the $7.85 area. This equity closed at $8.15 on Thursday March 21, 2002. |

|
| Figure 1: Daily chart for AMCC with the symmetrical triangle nearing completion. |
| Graphic provided by: SuperCharts. |
| |
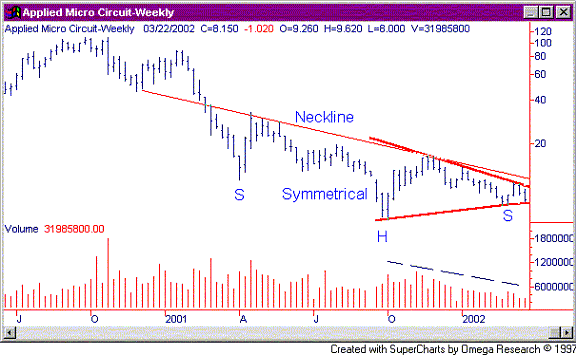
| One of the reasons to think long instead of short is because of the larger head and shoulders bottom reversal pattern that is near completion. Figure 2 shows the head and shoulders pattern is just over one year in length and looks like it is ready to move soon. Naturally, on a pattern of this size you must consider the time horizon. Bigger patterns tend to take more time to complete but when they move you get very good bang for your buck. |
 Figure 2: Weekly chart for AMCC, highlighting the developing head and shoulders pattern as well as the symmetrical triangle. A standard word of caution is necessary for those with weak stomachs. These patterns are not completed yet and could go either way. Perhaps the best way to play this one is to go long in the $8.00 - $8.30 area. I'd keep a stop-loss in the $7.70 area just in case the bottom line breaks. This precaution is necessary if you need to go to work and can't sit by your computer all day. In addition, if it goes down instead of up I would play it short on the downside breaking of $7.70. This is a very nice pattern and it is only a guess which way it will go. My prognostication is based on the volume spike of 15 million shares. I'm suspecting that it has bottomed temporarily and may climb up to the $10.00 breakout and slip back down. However, I see it moving upwards for the next few days. |
| Since I'm suspecting an upward move for a few days the options become interesting. Playing the April call options with a strike price of $7.50 or $10.00 is very interesting. If the equity price moves upwards towards the $10.00 breakout then the option price will likely double or triple depending on which strike price you trade. Of course, this is only if the price moves upwards. I also suggest that you sell your option on the first day the equity does not make a higher high. This will help keep you out of danger. Also, only put the amount of money into options that you can afford to lose-- If they expire they could be worthless. If the bottom line breaks then a good accumulation area to go long is in the $6.25 area where the head is located for the larger head and shoulders pattern. If it does go down it could go slightly lower than the head but if your time horizon is a few months or longer you won't be disappointed. |
Classic Dow Theorist who trades as a pure technician, using pattern recognition.
| Toronto, Canada |
Click here for more information about our publications!
Comments
Date: 03/26/02Rank: 5Comment:
Date: 03/26/02Rank: 4Comment:
Date: 03/26/02Rank: 5Comment:
Date: 03/27/02Rank: 1Comment: It broke the $7.85 line therefore an nice short ! I do not think so.

|

Request Information From Our Sponsors
- StockCharts.com, Inc.
- Candle Patterns
- Candlestick Charting Explained
- Intermarket Technical Analysis
- John Murphy on Chart Analysis
- John Murphy's Chart Pattern Recognition
- John Murphy's Market Message
- MurphyExplainsMarketAnalysis-Intermarket Analysis
- MurphyExplainsMarketAnalysis-Visual Analysis
- StockCharts.com
- Technical Analysis of the Financial Markets
- The Visual Investor
- VectorVest, Inc.
- Executive Premier Workshop
- One-Day Options Course
- OptionsPro
- Retirement Income Workshop
- Sure-Fire Trading Systems (VectorVest, Inc.)
- Trading as a Business Workshop
- VectorVest 7 EOD
- VectorVest 7 RealTime/IntraDay
- VectorVest AutoTester
- VectorVest Educational Services
- VectorVest OnLine
- VectorVest Options Analyzer
- VectorVest ProGraphics v6.0
- VectorVest ProTrader 7
- VectorVest RealTime Derby Tool
- VectorVest Simulator
- VectorVest Variator
- VectorVest Watchdog
