HOT TOPICS LIST
- MACD
- Fibonacci
- RSI
- Gann
- ADXR
- Stochastics
- Volume
- Triangles
- Futures
- Cycles
- Volatility
- ZIGZAG
- MESA
- Retracement
- Aroon
INDICATORS LIST
LIST OF TOPICS
PRINT THIS ARTICLE
by Sharon Yamanaka
When speed resistance lines meet with a support line, it seems reasonable to expect support to hold.
Position: Buy
Sharon Yamanaka
PRINT THIS ARTICLE
SPEED LINES
Boeing - Going Up?
03/18/02 01:56:39 PMby Sharon Yamanaka
When speed resistance lines meet with a support line, it seems reasonable to expect support to hold.
Position: Buy
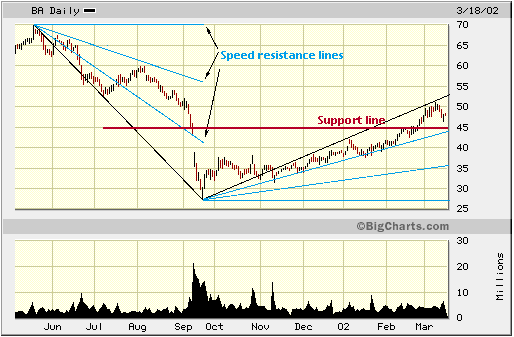
| Boeing (BA) has been in a nice upward trend since falling to a low of 27 after the Sept. 11th events. For the week of March 11-15 BA began retracing some of its gains. The question is, after almost doubling and reaching a high of 51,will they continue going up or will they reverse and begin a downward trend? |

|
| Figure 1 shows Boeing's daily chart for the past six months, to which are added speed resistance lines and a support line at 45. |
| Graphic provided by: Bigcharts.com. |
| |
| Speed resistance lines are based on Fibonacci fan lines and follow the theory that trends tend to reverse at intervals of one third. The resistance lines for BA are drawn by connecting the highest highs and lowest lows for the major trends. A horizontal line is drawn from the beginning of the trend until it intersects a vertical line drawn from the second point, forming a right angle. The vertical line is divided into thirds, and the speed resistance lines are drawn from the trend's point of origin to the one third and two third points on the vertical line. |
| Boeing seems to conform to the speed resistance lines - for the downward trend starting from mid-May 2002 to mid-September, BA traveled fairly consistently down the bottom third of the resistance lines before the downward momentum slowed and it went into the middle third. The jump-off point back to the lower third was exactly at the middle third's lower line. |
| In the current upward trend, going from mid-September to mid-March, BA has retraced almost one third of their substantial gains and is approaching the lower speed resistance line. I've drawn in an additional support line at 45, this appearing to be a level of resistance as Boeing advanced. Once Boeing passed this line, it became a support line, and with the additional support, added to the lower speed resistance line, there is double reason to believe that Boeing will begin advancing again. Extrapolating the resistance lines out a few more days, I'm expecting BA to reverse around 46 or 47. Should BA continue retracing and fall below the 45 support line, I would expect it to continue downward for another third and, again extrapolating the speed resistance lines out, find a bottom in the middle third at around 40. |
| Title: | Staff writer |
| Company: | Technical Analysis, Inc. |
| Website: | www.traders.com |
| E-mail address: | syamanaka@traders.com |
Traders' Resource Links | |
| Charting the Stock Market: The Wyckoff Method -- Books | |
| Working-Money.com -- Online Trading Services | |
| Traders.com Advantage -- Online Trading Services | |
| Technical Analysis of Stocks & Commodities -- Publications and Newsletters | |
| Working Money, at Working-Money.com -- Publications and Newsletters | |
| Traders.com Advantage -- Publications and Newsletters | |
| Professional Traders Starter Kit -- Software | |
Click here for more information about our publications!
Comments
Date: 03/19/02Rank: 3Comment:

Request Information From Our Sponsors
- StockCharts.com, Inc.
- Candle Patterns
- Candlestick Charting Explained
- Intermarket Technical Analysis
- John Murphy on Chart Analysis
- John Murphy's Chart Pattern Recognition
- John Murphy's Market Message
- MurphyExplainsMarketAnalysis-Intermarket Analysis
- MurphyExplainsMarketAnalysis-Visual Analysis
- StockCharts.com
- Technical Analysis of the Financial Markets
- The Visual Investor
- VectorVest, Inc.
- Executive Premier Workshop
- One-Day Options Course
- OptionsPro
- Retirement Income Workshop
- Sure-Fire Trading Systems (VectorVest, Inc.)
- Trading as a Business Workshop
- VectorVest 7 EOD
- VectorVest 7 RealTime/IntraDay
- VectorVest AutoTester
- VectorVest Educational Services
- VectorVest OnLine
- VectorVest Options Analyzer
- VectorVest ProGraphics v6.0
- VectorVest ProTrader 7
- VectorVest RealTime Derby Tool
- VectorVest Simulator
- VectorVest Variator
- VectorVest Watchdog
