HOT TOPICS LIST
- MACD
- Fibonacci
- RSI
- Gann
- ADXR
- Stochastics
- Volume
- Triangles
- Futures
- Cycles
- Volatility
- ZIGZAG
- MESA
- Retracement
- Aroon
INDICATORS LIST
LIST OF TOPICS
PRINT THIS ARTICLE
by David Penn
Remember "The Diamond in the Dow"? Well, now there's good news and bad news ...
Position: N/A
David Penn
Technical Writer for Technical Analysis of STOCKS & COMMODITIES magazine, Working-Money.com, and Traders.com Advantage.
PRINT THIS ARTICLE
TECHNICAL ANALYSIS
Slouching Toward Resistance
02/27/02 11:53:12 AMby David Penn
Remember "The Diamond in the Dow"? Well, now there's good news and bad news ...
Position: N/A
| Back in mid-February, I pointed to a short-term diamond pattern in the Dow's correction from the January highs ("The Diamond in the Dow", February 12, 2002. Traders.com Advantage). At the time, it was not clear whether the upside breakout from the 16-day chart pattern represented a real reversal (and subsequent move up) or was a bull trap or some other red herring in what would be a resumption of the Dow Industrial's downtrend. |
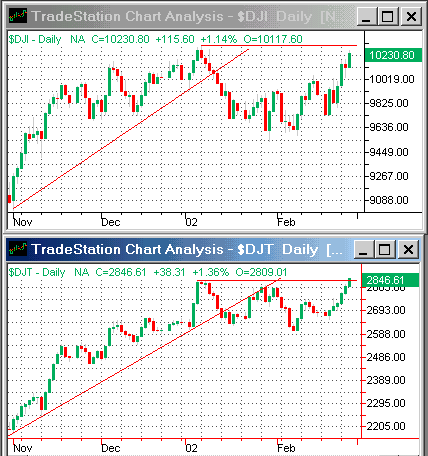
| Those questions have been answered. The Dow Industrials continued to move up and away from the diamond pattern and, by February 25th, reached the minimum upside breakout objective of 10140 (formation size added to the value at the point of the breakout). The good news is that those who played the diamond as a reversal--and have remained in the new short-term trend--have been rewarded with a Dow approaching 10,260 as of this writing, with a test of the January 2002 highs at about 10300 being the next likely challenge to the rally. |

|
| Simultaneous tests of top for the Dow Industrials and Dow Transports. |
| Graphic provided by: TradeStation. |
| |
| What is particularly impressive about the Dow Industrials reversal is the way the advance has been confirmed every step of the way by the Dow Transports, which is already engaged in a major test of its year-to-date highs of 2830. Should the Dow Transports set a new high and, moreoever, turn the old year-to-date high of 2830 into a source of support, then the Dow Industrials would be expected to fare well in its impending test of the top. Conversely, however, a Dow Transports that reverses course sharply or fails to close above the year-to-date high set on January 4th, would be very bearish for the Dow Industrials own attempt to take territory above 10,300. |
| So the good news is that the Dow diamond was real, the upside breakout a profitable opportunity, and likely support has been established at the top of the formation, around the 9950 area. If the Dow Industrials' rally takes time out for a breather--or if the first attempt to take out the January 2002 year-to-date high fails--look for the Dow to find some measure of support around 9950. |
| Unfortunately, the bottom of the summer 2001 range in the Dow Industrials also threatens the Industrial's current advance. This range has been variously described as a descending triangle as well ("The Dow's Descending Triangle", August 24, 2001. Traders.com Advantage). The salient point is that the horizontal support line of that descending triangle from the summer of 2001 now looms as a source of resistance to the current Dow advance. That horizontal support is at 10125. The January 2002 rally breached this point briefly before retreating, and the current diamond reversal breakout is also attempting to stay above this point. It is arguable that the present rally, for the Dow Industrials, is the biggest showdown since September 2001. But the Dow bulls need to make their case--and soon. |
Technical Writer for Technical Analysis of STOCKS & COMMODITIES magazine, Working-Money.com, and Traders.com Advantage.
| Title: | Technical Writer |
| Company: | Technical Analysis, Inc. |
| Address: | 4757 California Avenue SW |
| Seattle, WA 98116 | |
| Phone # for sales: | 206 938 0570 |
| Fax: | 206 938 1307 |
| Website: | www.Traders.com |
| E-mail address: | DPenn@traders.com |
Traders' Resource Links | |
| Charting the Stock Market: The Wyckoff Method -- Books | |
| Working-Money.com -- Online Trading Services | |
| Traders.com Advantage -- Online Trading Services | |
| Technical Analysis of Stocks & Commodities -- Publications and Newsletters | |
| Working Money, at Working-Money.com -- Publications and Newsletters | |
| Traders.com Advantage -- Publications and Newsletters | |
| Professional Traders Starter Kit -- Software | |
Click here for more information about our publications!
PRINT THIS ARTICLE

Request Information From Our Sponsors
- StockCharts.com, Inc.
- Candle Patterns
- Candlestick Charting Explained
- Intermarket Technical Analysis
- John Murphy on Chart Analysis
- John Murphy's Chart Pattern Recognition
- John Murphy's Market Message
- MurphyExplainsMarketAnalysis-Intermarket Analysis
- MurphyExplainsMarketAnalysis-Visual Analysis
- StockCharts.com
- Technical Analysis of the Financial Markets
- The Visual Investor
- VectorVest, Inc.
- Executive Premier Workshop
- One-Day Options Course
- OptionsPro
- Retirement Income Workshop
- Sure-Fire Trading Systems (VectorVest, Inc.)
- Trading as a Business Workshop
- VectorVest 7 EOD
- VectorVest 7 RealTime/IntraDay
- VectorVest AutoTester
- VectorVest Educational Services
- VectorVest OnLine
- VectorVest Options Analyzer
- VectorVest ProGraphics v6.0
- VectorVest ProTrader 7
- VectorVest RealTime Derby Tool
- VectorVest Simulator
- VectorVest Variator
- VectorVest Watchdog
