HOT TOPICS LIST
- MACD
- Fibonacci
- RSI
- Gann
- ADXR
- Stochastics
- Volume
- Triangles
- Futures
- Cycles
- Volatility
- ZIGZAG
- MESA
- Retracement
- Aroon
INDICATORS LIST
LIST OF TOPICS
PRINT THIS ARTICLE
by David Penn
The Dow 30 is breaking out from a 16-day diamond. But is the break up or down?
Position: N/A
David Penn
Technical Writer for Technical Analysis of STOCKS & COMMODITIES magazine, Working-Money.com, and Traders.com Advantage.
PRINT THIS ARTICLE
TECHNICAL ANALYSIS
The Diamond in the Dow
02/12/02 11:29:13 AMby David Penn
The Dow 30 is breaking out from a 16-day diamond. But is the break up or down?
Position: N/A
| While there may be little mystery as to whether or not the Nasdaq has wandered back into bear country (down 12.7% from the January 10th high), the S&P 500 and the Dow Industrials have seemed less determined to end their amazing advances from the September 11th lows. Down 5.8% and 4.3% from their January (year-to-date) highs, the S&P 500 and Dow still seem to have investors believing in the "mildest recovery ever" thesis that becomes increasingly popular each time the market rallies. |
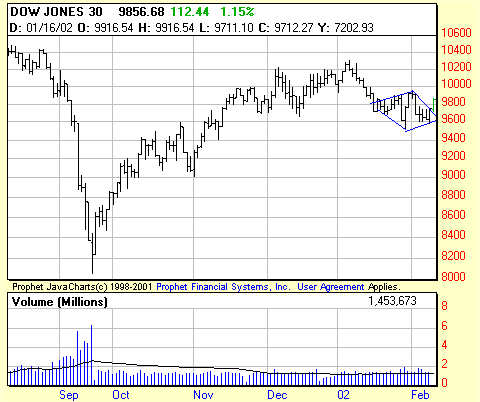
| But the Dow Industrials may be about to commit. Having started to decline moving into February, the Dow slowed into a tight congestion range featuring both higher highs and lower lows. This range has the aspect of a diamond pattern such as the ones we've encountered in the dollar ("The December Dollar's Diamond Bottom: Pullback or Failure", Traders.com Advantage, October 15, 2001), and the current upside breakout suggests that the Dow may actually be headed higher sooner than lower. |

|
| This diamond in the Dow Industrials suggests that a move of some size is increasingly likely. |
| Graphic provided by: ProphetFinance. |
| |
| The diamond pattern, as I mentioned, is characterized by a congestion that begins with prices in a very narrow range that gradually expands to feature both higher highs and lower lows. Sometime shortly after making particularly higher highs and lower lows, the congestion begins to contract, with lower highs and higher lows developing. Prices on successful patterns eventually break out from this shrinking range--although it can be difficult to determine in advance whether or not the breakout will be on the upside or downside. This snapshot of the Dow 30 (using the DIAs or diamonds) shows at least an initial breakout on the upside. However, as the diamond in the U.S. dollar showed, these breakouts can pullback sharply--at least until prices begin to move out and away from the formation, signaling the type of trend, continuation or reversal, they will pursue. |
| Given the size of the current Dow diamond, there is an upside target (formation size plus the value at the breakout point) of 10,200. This would set up the Dow Industrials for a test of the year-to-date highs from January--highs that also represent the culmination of the "war rally" that began in late September 2001. A downside breakdown here would likely send the Industrials down to about 9,300. This point is still significantly above the correction low in this September-January rally (that low being the early November low at 9,000), nevertheless a break to this level would still leave room for a test of support at 9,000. |
| As for initial support and resistance for the breakout, topside resistance is at 10,190. Support on the downside is at the formation bottom at 9,310. Strong closes above or below these points, respectively, may be strongly suggestive of further moves in that direction. |
Technical Writer for Technical Analysis of STOCKS & COMMODITIES magazine, Working-Money.com, and Traders.com Advantage.
| Title: | Technical Writer |
| Company: | Technical Analysis, Inc. |
| Address: | 4757 California Avenue SW |
| Seattle, WA 98116 | |
| Phone # for sales: | 206 938 0570 |
| Fax: | 206 938 1307 |
| Website: | www.Traders.com |
| E-mail address: | DPenn@traders.com |
Traders' Resource Links | |
| Charting the Stock Market: The Wyckoff Method -- Books | |
| Working-Money.com -- Online Trading Services | |
| Traders.com Advantage -- Online Trading Services | |
| Technical Analysis of Stocks & Commodities -- Publications and Newsletters | |
| Working Money, at Working-Money.com -- Publications and Newsletters | |
| Traders.com Advantage -- Publications and Newsletters | |
| Professional Traders Starter Kit -- Software | |
Click here for more information about our publications!
Comments
Date: 02/26/02Rank: 5Comment:

|

Request Information From Our Sponsors
- StockCharts.com, Inc.
- Candle Patterns
- Candlestick Charting Explained
- Intermarket Technical Analysis
- John Murphy on Chart Analysis
- John Murphy's Chart Pattern Recognition
- John Murphy's Market Message
- MurphyExplainsMarketAnalysis-Intermarket Analysis
- MurphyExplainsMarketAnalysis-Visual Analysis
- StockCharts.com
- Technical Analysis of the Financial Markets
- The Visual Investor
- VectorVest, Inc.
- Executive Premier Workshop
- One-Day Options Course
- OptionsPro
- Retirement Income Workshop
- Sure-Fire Trading Systems (VectorVest, Inc.)
- Trading as a Business Workshop
- VectorVest 7 EOD
- VectorVest 7 RealTime/IntraDay
- VectorVest AutoTester
- VectorVest Educational Services
- VectorVest OnLine
- VectorVest Options Analyzer
- VectorVest ProGraphics v6.0
- VectorVest ProTrader 7
- VectorVest RealTime Derby Tool
- VectorVest Simulator
- VectorVest Variator
- VectorVest Watchdog
