HOT TOPICS LIST
- MACD
- Fibonacci
- RSI
- Gann
- ADXR
- Stochastics
- Volume
- Triangles
- Futures
- Cycles
- Volatility
- ZIGZAG
- MESA
- Retracement
- Aroon
INDICATORS LIST
LIST OF TOPICS
PRINT THIS ARTICLE
by David Penn
Can you be bullish on gold and the dollar at the same time?
Position: N/A
David Penn
Technical Writer for Technical Analysis of STOCKS & COMMODITIES magazine, Working-Money.com, and Traders.com Advantage.
PRINT THIS ARTICLE
TECHNICAL ANALYSIS
Rising Gold Price, Crouching Dollar?
02/07/02 02:16:21 PMby David Penn
Can you be bullish on gold and the dollar at the same time?
Position: N/A
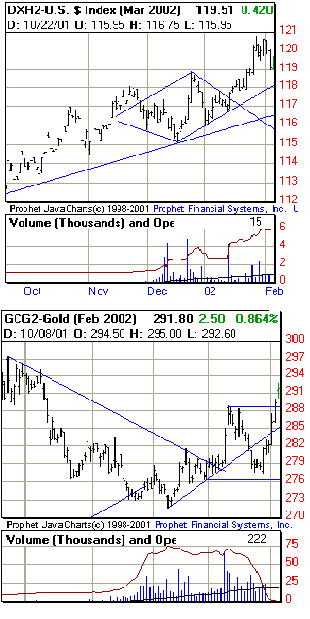
| Fewer contradictions in intermarket technical analysis are more confounding than simultaneous bull markets in gold and the greenback. The bull market in the greenback has been the stuff of legend. From a bottom of 90 in the fall of 1998, the U.S. Dollar Index has advanced over 30%. The four months of price action in the greenback seen here represent the last half of a rally that began in September 2001 with an intermediate diamond bottom (see "The December Dollar's Diamond Bottom: Pullback or Failure?", 10/15/01, Traders.com Advantage). That rally comes in response to a July-August correction that took the greenback from historic highs. By "historic", I mean a fifteen-year high. The greenback was last at 121 in 1986. |
| Gold has fared less well, to say the least. Gold is moving toward the later stage of its current rally, having bottomed in mid-December 2001 and gaining about 7% since. It should be pointed out that the larger, intermediate-term trend of gold is up; a significant bottom was put in back in April 2001 (this was actually a test of the bottom put in place in September 1999). The price action in gold seen here includes the tail-end of the September 1999-April 2001 bear market in gold--a period of particular bullishness in both the U.S. dollar and the U.S. equity markets. |

|
| Simultaneously rising prices in gold and the dollar suggest growing uncertainty in the marketplace. |
| Graphic provided by: Prophet Finance. |
| |
| The inverse relationship between gold and the dollar is almost common sense for most. As a leading indicator for inflation, rises in the gold price tend to anticipate inflation and dollar weakness, just as declines in the gold price tend to anticipate deflation (or at least disinflation) and dollar strength. So how can these truisms be understood in a context wherein both gold and the greenback are rising? Looking at the five-month charts, the dollar looks to be rallying from support created at the top of the diamond it broke free from in mid-January. Should this support hold, then a test of the highs created from the breakout (see "More on the Dollar and Commodities" 1/25/02, Traders.com Advantage) would be expected next. This is the 121 level mentioned earlier. As for gold, the parabolic nature of the current move makes it less likely that gold's high-flying will be particularly long lasting. Gold bulls have learned the hard way that rallies in the yellow metal have tended to come swiftly and end just as swiftly--though it appears gold investors may be more vulnerable to this tendency than gold traders. |
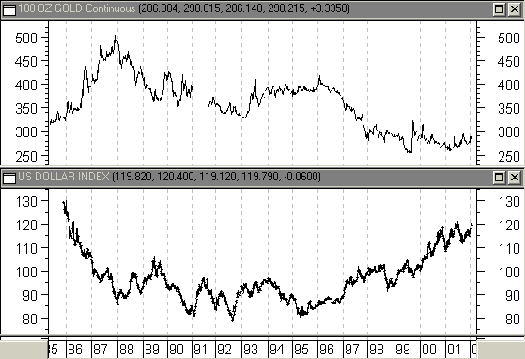
 Figure 2: Long-term charts for gold and the dollar. The longer-term historical charts may be helpful context. Here, we note that the dollar has had a six and a half year swoon from 130 in 1986 to bottom at 80 in 1992. The greenback maintained a range from about 95 to 80 for four years before beginning on another six and a half year move, this one bullish, which is taking the dollar back to its mid-1980s highs. The choppy price action in the greenback from mid-2001 to present has a toppish appearance--even a head and shoulders top would be a possibility should the greenback fail to break 121 in the current rally. |
| It is difficult for investors of the 1980s and 1990s to imagine a real, primary bull market in gold. As the longer-term chart shows, gold prices have been falling steadily since 1987. In fact, gold lost half of its value from late 1987 (500) to the 1999 bottom (250). The question now is whether this represents a real bottom in the yellow metal--as opposed to a consolidation range on the way to lower lows (as was the price action in gold from 1994-1996). As mentioned elsewhere ("Intermarket Gold Digging" 1/28/02, Traders.com Advantage), shares in gold mining companies tend to lead the gold price, so the fortunes of companies like AngloGold and Barrick Gold Company may be worthwhile indicators for the fortunes of gold. |
Technical Writer for Technical Analysis of STOCKS & COMMODITIES magazine, Working-Money.com, and Traders.com Advantage.
| Title: | Technical Writer |
| Company: | Technical Analysis, Inc. |
| Address: | 4757 California Avenue SW |
| Seattle, WA 98116 | |
| Phone # for sales: | 206 938 0570 |
| Fax: | 206 938 1307 |
| Website: | www.Traders.com |
| E-mail address: | DPenn@traders.com |
Traders' Resource Links | |
| Charting the Stock Market: The Wyckoff Method -- Books | |
| Working-Money.com -- Online Trading Services | |
| Traders.com Advantage -- Online Trading Services | |
| Technical Analysis of Stocks & Commodities -- Publications and Newsletters | |
| Working Money, at Working-Money.com -- Publications and Newsletters | |
| Traders.com Advantage -- Publications and Newsletters | |
| Professional Traders Starter Kit -- Software | |
Click here for more information about our publications!
Comments
Date: 02/12/02Rank: 5Comment:

Request Information From Our Sponsors
- StockCharts.com, Inc.
- Candle Patterns
- Candlestick Charting Explained
- Intermarket Technical Analysis
- John Murphy on Chart Analysis
- John Murphy's Chart Pattern Recognition
- John Murphy's Market Message
- MurphyExplainsMarketAnalysis-Intermarket Analysis
- MurphyExplainsMarketAnalysis-Visual Analysis
- StockCharts.com
- Technical Analysis of the Financial Markets
- The Visual Investor
- VectorVest, Inc.
- Executive Premier Workshop
- One-Day Options Course
- OptionsPro
- Retirement Income Workshop
- Sure-Fire Trading Systems (VectorVest, Inc.)
- Trading as a Business Workshop
- VectorVest 7 EOD
- VectorVest 7 RealTime/IntraDay
- VectorVest AutoTester
- VectorVest Educational Services
- VectorVest OnLine
- VectorVest Options Analyzer
- VectorVest ProGraphics v6.0
- VectorVest ProTrader 7
- VectorVest RealTime Derby Tool
- VectorVest Simulator
- VectorVest Variator
- VectorVest Watchdog
