

HOT TOPICS LIST
- MACD
- Fibonacci
- RSI
- Gann
- ADXR
- Stochastics
- Volume
- Triangles
- Futures
- Cycles
- Volatility
- ZIGZAG
- MESA
- Retracement
- Aroon
INDICATORS LIST
LIST OF TOPICS
PRINT THIS ARTICLE
by David Penn
As the gold pullback continues, the S&P 500 precious metals index rallies.
Position: N/A
David Penn
Technical Writer for Technical Analysis of STOCKS & COMMODITIES magazine, Working-Money.com, and Traders.com Advantage.
PRINT THIS ARTICLE
TECHNICAL ANALYSIS
Intermarket Gold-Digging
01/28/02 01:24:19 PMby David Penn
As the gold pullback continues, the S&P 500 precious metals index rallies.
Position: N/A
| An increasing number of market watchers have begun to look at gold, which has been in an extended bear market (really since the 1980 peak of $850/ounce), as a source of investment potential. The arguments behind these bullish suspicions are varied and, as of early 2002, remain largely on the margins of financial and economic thinking. But as I've noted elsewhere ('A Bull Market in Gold?' January 22, 2002; Traders.com Advantage), there is technical support for a rally in gold. Whether this rally in gold and other precious metals is the start of a new primary bull market, or simply represents another secondary correction in an exceptionally long bear market, remains to be seen. However, the increased attention gold has been receiving in 2002 makes it worthwhile to look for additional technical signals that the yellow metal is, or is not, on the rise. |
| Intermarket analysis conducted by John Murphy (see his Intermarket Technical Analysis) asserts that shares in gold mining companies often lead gold prices, much in the same way that gold prices tend to lead other commodities (as represented by the CRB Index). As such, one way to confirm the bullishness of gold would be to check the performance of gold mining companies. Another way to use intermarket analysis to confirm a gold bull market would be to compare the performance of gold with the performance of the precious metals index. |
|
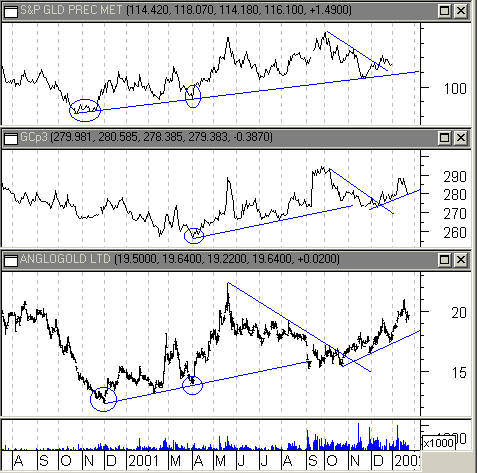
| Gold companies and the precious metals index lead gold futures. |
| Graphic provided by: MetaStock. |
| |
| The chart provided does some of both. The price action of shares of one of the larger gold companies, AngloGold Limited is compared to the performance of both the S&P Precious Metals Index as well as the continuous gold futures contract. There are other gold companies that could be used: Placer Dome, Inc. (PDG), Anglo American PLC (AAUK), Newmont Mining (NEM) and Barrick Gold Corp. (ABX) in particular. But the price charts of these companies are very much reflective of each other, particularly on the longer-term. Thus, AngloGold (AU) is a reasonable proxy here for the larger gold companies. |
| What the chart reveals is telling. Both the S&P Gold and Precious Metals Index (GPMI) and shares of AngloGold (AU) bottomed in November 2000, while the continuous gold contract did not reach a final bottom until March 2001-- nearly five months afterward. Interestingly, when the gold contract put in its bottom, both the GMPI and shares of AU made successful tests of their upward trendlines. A sharp-eyed gold market watcher would have taken this as a positive indication that gold futures had indeed established a bottom-- given the strength in the Index as well as in shares of gold companies. |
| Does this intermarket approach to gold tell us anything about the current gold rally? If the rally in gold futures has "legs," an intermarket analysis would anticipate strength in both the GPMI as well as in gold companies such as AngloGold. Looking at the chart, gold futures look to be in danger of dropping beneath their upward trendline. However the S&P Gold and Precious Metals looks to be rallying, pulling up short from a hard test of its upward trendline. AngloGold's price action is inconclusive. A continued correction back toward the trendline at 18.5 from the shares current price of about 19.5 should serve as a valuable test not only for AngloGold, but perhaps for gold and precious metals in general, as well. |
Technical Writer for Technical Analysis of STOCKS & COMMODITIES magazine, Working-Money.com, and Traders.com Advantage.
| Title: | Technical Writer |
| Company: | Technical Analysis, Inc. |
| Address: | 4757 California Avenue SW |
| Seattle, WA 98116 | |
| Phone # for sales: | 206 938 0570 |
| Fax: | 206 938 1307 |
| Website: | www.Traders.com |
| E-mail address: | DPenn@traders.com |
Traders' Resource Links | |
| Charting the Stock Market: The Wyckoff Method -- Books | |
| Working-Money.com -- Online Trading Services | |
| Traders.com Advantage -- Online Trading Services | |
| Technical Analysis of Stocks & Commodities -- Publications and Newsletters | |
| Working Money, at Working-Money.com -- Publications and Newsletters | |
| Traders.com Advantage -- Publications and Newsletters | |
| Professional Traders Starter Kit -- Software | |
Click here for more information about our publications!
PRINT THIS ARTICLE

Request Information From Our Sponsors
- StockCharts.com, Inc.
- Candle Patterns
- Candlestick Charting Explained
- Intermarket Technical Analysis
- John Murphy on Chart Analysis
- John Murphy's Chart Pattern Recognition
- John Murphy's Market Message
- MurphyExplainsMarketAnalysis-Intermarket Analysis
- MurphyExplainsMarketAnalysis-Visual Analysis
- StockCharts.com
- Technical Analysis of the Financial Markets
- The Visual Investor
- VectorVest, Inc.
- Executive Premier Workshop
- One-Day Options Course
- OptionsPro
- Retirement Income Workshop
- Sure-Fire Trading Systems (VectorVest, Inc.)
- Trading as a Business Workshop
- VectorVest 7 EOD
- VectorVest 7 RealTime/IntraDay
- VectorVest AutoTester
- VectorVest Educational Services
- VectorVest OnLine
- VectorVest Options Analyzer
- VectorVest ProGraphics v6.0
- VectorVest ProTrader 7
- VectorVest RealTime Derby Tool
- VectorVest Simulator
- VectorVest Variator
- VectorVest Watchdog