HOT TOPICS LIST
- MACD
- Fibonacci
- RSI
- Gann
- ADXR
- Stochastics
- Volume
- Triangles
- Futures
- Cycles
- Volatility
- ZIGZAG
- MESA
- Retracement
- Aroon
INDICATORS LIST
LIST OF TOPICS
PRINT THIS ARTICLE
by Dennis D. Peterson
Using the opening range can allow you to fade an open or to trade with the move.
Position: N/A
Dennis D. Peterson
Market index trading on a daily basis.
PRINT THIS ARTICLE
DAY TRADING
Opening Range
02/04/02 12:17:20 PMby Dennis D. Peterson
Using the opening range can allow you to fade an open or to trade with the move.
Position: N/A
| The first step in trading the opening range is to have a working definition of opening range. I have noticed that each stock or index has its own time frame to develop an opening range. Some develop the opening range sooner than others. Ideally you have an indicator that gives you the average of opening range times over the last two weeks, since the time it takes to develop an opening range can change every few weeks. I have been working on an indicator, but am still forced at the moment to do it manually --as you will see it is not easy to encode. So how do you go about determining when an opening range has been formed? |
| I use pivots based on two-minute intervals to try and determine when price is going to break out of its opening range. Some days have no breakouts, as price just goes sideways. I am not looking for a value of opening range, instead I am trying to find out when, on average, the stock or index will tell me what direction, if any, it is going to take. Figure 1 illustrates typical opening price actions. |

|
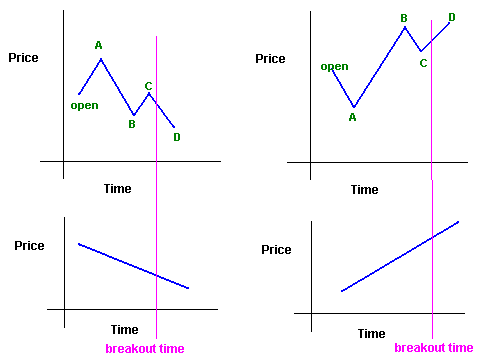
| Figure 1: Hypothetical price time relationships. The top half shows price heading down (left) and heading up (right). The bottom half shows price heading down with no pivots (left) and heading up with no pivots (right). Using intraday charts from the top half you determine when price takes a direction and you confirm that the time is right by charts like those on the bottom, that price continues to move in the same direction after the “breakout time.” |
| Graphic provided by: MetaStock. |
| Graphic provided by: Data Vendor: eSignal. |
| |
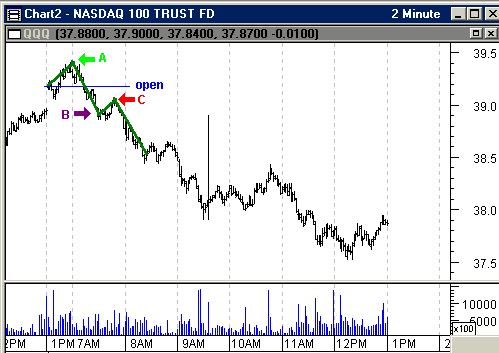
| First, select those charts where price clearly ended up or down at the end of the day or one hour before market close. Clearly up or down means that price finishes above the highest pivot peak or below the lowest pivot valley determined by pivots found in the first one and half hours of trading - but remember the time you will find is going to be less than an hour and half - just don't go beyond an hour and half after the market opens. Again, you can take the phrase "price finishes" to mean one hour before market close. If the market continues in the same direction in the last hour then include those as well. If price stays between the highest pivot peak and the lowest pivot valley don't use that day for determining the time. Starting with the chart in the upper left hand corner of Figure 1 you have an open that rises to pivot A, reverses, goes to pivot B, and so on. At what time did the market make up its mind to go down? Shortly after pivot C. So that is one time mark you are going to put in the sum to find an average time. The chart (Figure 1)on the bottom left shows price that just went on down. By down I mean up to one hour before closing or to close of market. If you find the time you have chosen works as a short for the bottom left chart, then it is a confirmation that you have a reasonable time. Another way to look at the bottom left chart is to ask yourself at what time after open you would be reasonably sure that the market has made up its mind the direction is down when there are no pivots. The chart on the upper right hand corner of Figure 1 is the mirror image of the chart on the upper left. The market opens, sells to pivot A, rallys to pivot B, sells again to C, and then it's on its way up. Again, mark the time as shown in the right top chart and add to the sum. After accumulating 10 times, take an average and that is what you use for determining when to place an order. Or use fewer if you find that all the times are about equal. Now I am going throw a small clinker in this because I have avoided using opening range as such. First ask, "Is the opening range the difference between the open and A, or the difference between A and B?" Not meaning to make a pun, but does it make a difference which difference you use? If you look closely at the two top charts on Figure 1 you will see that on the left the difference between the open and A is about the same as the difference between open and B. But in the right hand chart the difference between the open and B is greater than the difference between the open and A. As soon as I see that the market is willing to take the price higher above the opening than below the open, I am going to think long. As soon as pivot valley C of the right hand chart shows up above pivot valley A, and then price moves above pivot peak B, it is time to think about an order. One example (Figure 2) should illustrate the technique. First I selected this particular day because price had made a clear move from the open, in this case down. You don't have to make such dramatic choices - just don't pick one where price moves up and down between pivots A and B. Next I connected the front end pivots, A, B, and C. With pivot peak C below pivot peak A price is on its way down, and C occurs 78 minutes after open. That's one data point for your average. However, the argument could be made that since the difference between pivot valley B and the open is greater than the difference between pivot peak A and the open, then you would know at pivot valley B, which occurs 60 minutes after open. You might want to compromise and make the time the average of the two: 69 = (78+60)/2. In any event, keep gathering times until you are confident you know the time. |
 Figure 2: QQQ two-minute intervals. The time at which QQQ made its decision to go on down was at pivot C, because C is lower than pivot A. This was at 7:48 or 1 hour and 18 minutes after open. The argument could be made that direction was known when B developed because the distance from the open to B is greater than the distance from the open to A, and the move down is not a steep selloff, like that which occurs right around 9:00. B occurs around 7:30 and so for this day your time could be either 78 minutes or 69 = (78 +60)/2 minutes, the average of the two. Now you want to find additional days to build a recent average. Now I want to see the price move in some confirming way out of the range from A to B. Prices that run straight up or down don't do anything for developing a time except to confirm what you are already conjecturing. For a setup you might consider the conditions given in "Common Themes in Trading Systems - Daily Ranges and Short Sequences" posted on 10/22/01. For example, if yesterday was an up day and today's open is above yesterday's close, a "++" day, then your setup is to short today. You are looking for price action similar to that on the top left hand chart. You know approximately how long you have to wait and if you happen to hit a day like the bottom left chart with a short, it could make your day. Get your setup from daily charts, confirm using intraday pivot peaks and valleys and know when the time best favors your order. What you will find is that after going through days of charts, sometimes price just bounces between opening pivots, or if price does move out of a price channel it is so small that it is hardly worth trading. But you don't have to use the article I mentioned above for a setup, some of the best setups come off of narrow range days, such as NR4 days. Just let the market tell you what it wants to do. It's equally important that you combine daily and intraday price change. In addition if you see price moving up to meet resistance, or down to support, via an Andrew's pitchfork channel built around daily data you can improve your odds considerably. By the way, if you chart weekly QQQ data you will see an inverted saucer, which is bearish, and fits nicely with a 1/28/2002 NR4 day, since the above chart is for 1/29/2002. |
Market index trading on a daily basis.
| Title: | Staff Writer |
| Company: | Technical Analysis, Inc. |
| Address: | 4757 California Ave SW |
| Seattle, WA 98116-4499 | |
| Phone # for sales: | 206 938 0570 |
| Fax: | 206 938 1307 |
| Website: | www.traders.com |
| E-mail address: | dpeterson@traders.com |
Traders' Resource Links | |
| Charting the Stock Market: The Wyckoff Method -- Books | |
| Working-Money.com -- Online Trading Services | |
| Traders.com Advantage -- Online Trading Services | |
| Technical Analysis of Stocks & Commodities -- Publications and Newsletters | |
| Working Money, at Working-Money.com -- Publications and Newsletters | |
| Traders.com Advantage -- Publications and Newsletters | |
| Professional Traders Starter Kit -- Software | |
Click here for more information about our publications!
Comments
Date: 02/05/02Rank: 4Comment:
Date: 02/15/02Rank: 5Comment:

Request Information From Our Sponsors
- StockCharts.com, Inc.
- Candle Patterns
- Candlestick Charting Explained
- Intermarket Technical Analysis
- John Murphy on Chart Analysis
- John Murphy's Chart Pattern Recognition
- John Murphy's Market Message
- MurphyExplainsMarketAnalysis-Intermarket Analysis
- MurphyExplainsMarketAnalysis-Visual Analysis
- StockCharts.com
- Technical Analysis of the Financial Markets
- The Visual Investor
- VectorVest, Inc.
- Executive Premier Workshop
- One-Day Options Course
- OptionsPro
- Retirement Income Workshop
- Sure-Fire Trading Systems (VectorVest, Inc.)
- Trading as a Business Workshop
- VectorVest 7 EOD
- VectorVest 7 RealTime/IntraDay
- VectorVest AutoTester
- VectorVest Educational Services
- VectorVest OnLine
- VectorVest Options Analyzer
- VectorVest ProGraphics v6.0
- VectorVest ProTrader 7
- VectorVest RealTime Derby Tool
- VectorVest Simulator
- VectorVest Variator
- VectorVest Watchdog
