HOT TOPICS LIST
- MACD
- Fibonacci
- RSI
- Gann
- ADXR
- Stochastics
- Volume
- Triangles
- Futures
- Cycles
- Volatility
- ZIGZAG
- MESA
- Retracement
- Aroon
INDICATORS LIST
LIST OF TOPICS
PRINT THIS ARTICLE
by Dennis D. Peterson
Using Cole and Weinberg as a basis for a trading system isn't the only place you'll find the use of daily ranges and short sequences.
Position: N/A
Dennis D. Peterson
Market index trading on a daily basis.
PRINT THIS ARTICLE
TRADING SYSTEMS
Common Themes in Trading Systems -- Daily Ranges and Short Sequences
10/22/01 03:06:13 PMby Dennis D. Peterson
Using Cole and Weinberg as a basis for a trading system isn't the only place you'll find the use of daily ranges and short sequences.
Position: N/A
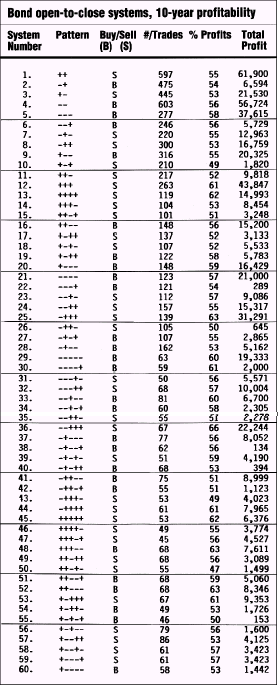
How would you trade on a day when the open is higher than the close of the previous day? Go long at the open? Tony Crabel might have a different idea. Figure 1 is extracted from the September '89 TASC article "Price Patterns" by Crabel. Figure 1: Equity performance trading price patterns of T-bond futures. |
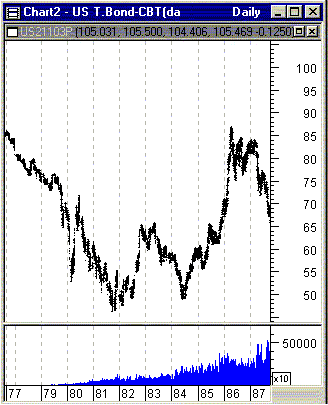
| First you need to know how to read the chart. The last "+" or "-" in the pattern column means the day you are going to enter has an open greater than the previous day's close, "+", or the open is less than the previous day's close, "-". Pluses or minuses leading up to the last mean the following: + = close of day is greater than the close of previous day, - = close of day is less than the close of previous day. Looking at the first system (Figure1: system #1), which is "++" means today's open is greater than yesterday's close, and yesterday was an up day. So what do you do? Short the market. Looking at the 10-year statistics that cover 597 trades, you have made money. So what's wrong with this picture? Not much. If you look at Crabel's time frame of US Treasury bond futures (Figure 2) between 1977 and 1987, it is a reasonable mix of uptrend and downtrend. |

|
| Figure 2: T-bond futures (CBT) perpetual contract. Crabel’s choice of timeframe is a period when T-bond futures were both up and down. |
| Graphic provided by: MetaStock. |
| Graphic provided by: Data Vendor: Commodity Systems, Inc (CSI). |
| |
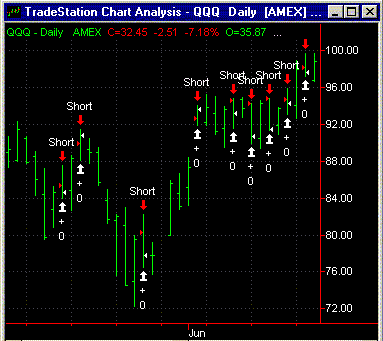
| You might be saying at this point that while a profit was made on a futures market, a comparable equities market won't be found for a profit. If you implement "++" as a trading system (Metastock cannot do this, but Tradestation can) using the formula: if Open next bar > Close and Close > Close 1 bar ago then SellShort next bar at Open; SetExitOnClose ;) Trading QQQ, the result may surprise you. Taking a close look at one of the better upswings which occurred with QQQ at the beginning of June '00 you might expect that you would lose your shirt. But, what you see (Figure 3) is that while your first trade in June is a loss, the next five short trades all turn a profit and they are all on the heels of the big gap up that was made at the beginning of June. The way to read each of the short entries is to look for a red arrowhead attached to an OHLC bar, with the exit shown on the same bar as a white arrowhead. |
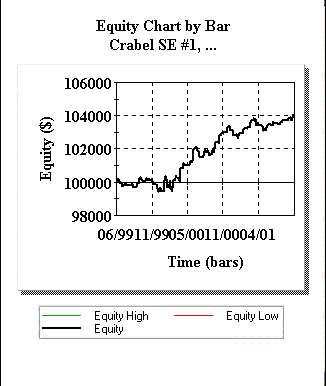
 Figure 3: Daily QQQ for June 2000. OHLC bars are annotated with red arrowhead short entries and white arrowhead short exits. Short entry is done on the open and covering at the close of the same day. The beginning of June marked a breakout gap up, which would suggest long positions are the winning strategy not shorts. Graphic source: Tradestation Data Vendor: Tradestation How does equity performance do? Each trade shorts 100 shares at the open and covers with a second transaction at exit of the same day, and I set the fees to be $.01/share. Total net profit was $4,083 with a profit factor of 1.47 on 91 winning and 77 losing trades, trading from March '99 to the present. You might now assume that most of the profit was made since September '00 by making substantial gains to offset losses in '99. Looking at the equity performance (Figure 4) that's not what happened.  Figure 4: Equity performance trading QQQ daily with Crabel's "++" system. One hundred shares are sold and covered each trade. Instead of losing your shirt short trading in early '99 you end up at about breakeven. This kind of performance suggests shorting is a valuable tool in your investing repertoire. Graphic source: Tradestation |
| Now let's go back and compare some of Crabel's systems to see if there is a pattern to the systems. If "++" results in shorting, what does he do with "+++"? He shorts of course. He made a profit of $61,900 on "++" and then makes a profit of $43,847 on "+++" (Figure 1: system #12). What about "++++" (Figure 1: system #13)? Short and make $14,993 profit. Why is profit declining while "+"s are increasing? Because an uptrend is more firmly established with each additional up day as indicated by an additional "+". Similarly going long after "- - " results in declining profits as each "-" is added, since each added "-" shows a strengthening downtrend. If you look at the first four patterns ++, -+, +-, - - you see how Crabel would suggest a short or long position. Any pattern ending in ++ is going to be a short, except for one and it is one of the few cases where both long and a short position are taken - the pattern is "+-++" (Figure 1: systems #17 and #19). Every pattern ending in - - is going to be long, except "+-+--" (Figure 1: system #56). Taking the next two patterns +- and -+, for +- it looks like an upswing so buy, and for -+ it looks like a downswing so short. But what are the profits from +- and -+? They are below ++ and - - substantially, especially -+. In fact if you trade +- and -+, depending on what pattern precedes it, you could end up with $134 after 10 years (Figure 1: system #38), the prize for the lowest profit. So what's the moral of this story? If you trade longer patterns with fewer trades you make less. Trying to increase profit by looking for longer patterns of up versus down days does not increase your odds of being successful. Crabel suggests patterns 5, 9, 12, 13, 21, 24, 25, 29, 30, 33, 36, 44, 45, 52 and 53 are worthy of further investigation. I have to admit in view of the results I don't see it. But he does go on to say that he saw that the best profits come in uptrends and downtrends, and not in sideways movements. I totally agree with that. He finishes the article by saying, "In fact, daily range differences relative to the previous day or days may be one of the most useful approaches I have found." If you go back to my previous article, "Common Themes In Trading" posted on 9/27/2001, I had to use Weinberg's True Range Indicator to filter Cole reaction and rally day sequences. If you look closely you will see that I only required two reaction or rally days in a row. I wasn't looking for a long sequence. I wanted to find a way to filter short sequences. I filtered using daily ranges. I also used a simple momentum indicator to see if I was in an uptrend or a downtrend. The use of daily ranges, short sequences, and trend indications are themes for trading systems that repeat over and over again. But can you do better? Yes. Crabel has one other suggestion-- to use opening range breakouts. But now the rub, what do you use for an opening range? You might say the first five minutes of course. Really? What I have seen is that more volatile stocks take longer to settle down. I'll grant that some establish their range in the first five minutes, but others take longer, up to an hour. The rub is that what you want to program is a setup based on daily data, for example up days or rally days-- the two are slightly different-- filtered by range and trend direction, and then entry confirmed by opening range breakout. But opening range uses intraday data. If I find a way to program daily in conjunction with intraday I will pass it on. |
Market index trading on a daily basis.
| Title: | Staff Writer |
| Company: | Technical Analysis, Inc. |
| Address: | 4757 California Ave SW |
| Seattle, WA 98116-4499 | |
| Phone # for sales: | 206 938 0570 |
| Fax: | 206 938 1307 |
| Website: | www.traders.com |
| E-mail address: | dpeterson@traders.com |
Traders' Resource Links | |
| Charting the Stock Market: The Wyckoff Method -- Books | |
| Working-Money.com -- Online Trading Services | |
| Traders.com Advantage -- Online Trading Services | |
| Technical Analysis of Stocks & Commodities -- Publications and Newsletters | |
| Working Money, at Working-Money.com -- Publications and Newsletters | |
| Traders.com Advantage -- Publications and Newsletters | |
| Professional Traders Starter Kit -- Software | |
Click here for more information about our publications!
Comments
Date: 10/25/01Rank: 5Comment:
Date: 11/18/01Rank: 4Comment:

|

Request Information From Our Sponsors
- StockCharts.com, Inc.
- Candle Patterns
- Candlestick Charting Explained
- Intermarket Technical Analysis
- John Murphy on Chart Analysis
- John Murphy's Chart Pattern Recognition
- John Murphy's Market Message
- MurphyExplainsMarketAnalysis-Intermarket Analysis
- MurphyExplainsMarketAnalysis-Visual Analysis
- StockCharts.com
- Technical Analysis of the Financial Markets
- The Visual Investor
- VectorVest, Inc.
- Executive Premier Workshop
- One-Day Options Course
- OptionsPro
- Retirement Income Workshop
- Sure-Fire Trading Systems (VectorVest, Inc.)
- Trading as a Business Workshop
- VectorVest 7 EOD
- VectorVest 7 RealTime/IntraDay
- VectorVest AutoTester
- VectorVest Educational Services
- VectorVest OnLine
- VectorVest Options Analyzer
- VectorVest ProGraphics v6.0
- VectorVest ProTrader 7
- VectorVest RealTime Derby Tool
- VectorVest Simulator
- VectorVest Variator
- VectorVest Watchdog
