HOT TOPICS LIST
- MACD
- Fibonacci
- RSI
- Gann
- ADXR
- Stochastics
- Volume
- Triangles
- Futures
- Cycles
- Volatility
- ZIGZAG
- MESA
- Retracement
- Aroon
INDICATORS LIST
LIST OF TOPICS
PRINT THIS ARTICLE
by Austin Passamonte
Look for the retail sector to react to holiday sales figures. Watching these figures and the charts may lead to some high-odds entry points.
Position: N/A
Austin Passamonte
Austin is a private trader who trades emini stock index futures intraday. He currently trades various futures markets from home in addition to managing a trader's educational forum
PRINT THIS ARTICLE
SUPPORT & RESISTANCE
Will Retail Be Naughty Or Nice?
01/08/02 10:13:30 AMby Austin Passamonte
Look for the retail sector to react to holiday sales figures. Watching these figures and the charts may lead to some high-odds entry points.
Position: N/A
| The stocks were pulled down from the chimney without care as holiday gifts were reveled in with glee. Did that annual passage equate to stellar performance across the entire retail index? |
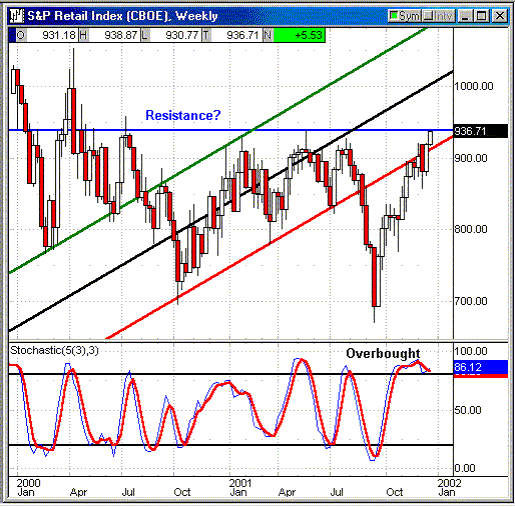
| The RLX Retail Index followed a distinct channel until the August & September declines broke down in dramatic fashion. But all things eventually return to their mean and once again we see price action trying to regain former patterns. |

|
| Figure 1: Weekly Chart: RLX |
| Graphic provided by: Quote.com. |
| Graphic provided by: QCharts. |
| |
| At this point we see that price action has barely broken back into the continued channel and immediately found historical resistance. Meanwhile we see grossly overbought stochastic values that reflect the recent run via index leaders such as Wal-Mart, Target, Kohls, etc. Stochastic values have remained pinned in overbought extreme for months, but that will not last forever. Question is, will price action merely move sideways and consolidate when oscillators release from extreme zones or is a direction change imminent soon? |
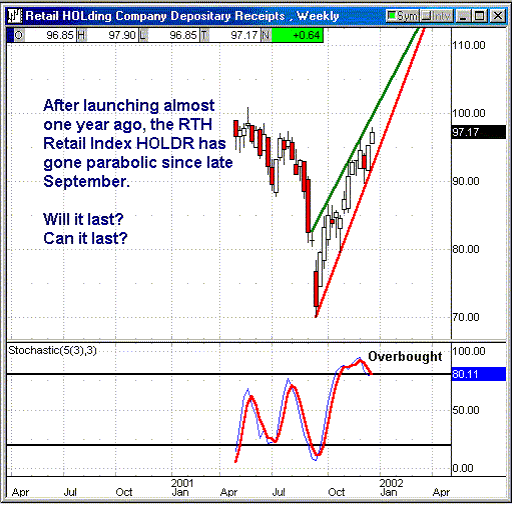
 Figure 2: Weekly chart: RTH Retail sector HOLDR shares or options are one way to play the entire index in lower beta fashion than individual stocks. Merely watching the current vertical wedge to break either way should offer a high-odds entry for long or short direction. With stochastic values grossly overbought and parabolic price action unsustainable forever, watching for downside direction next might tip the scales as a biased market guess. |
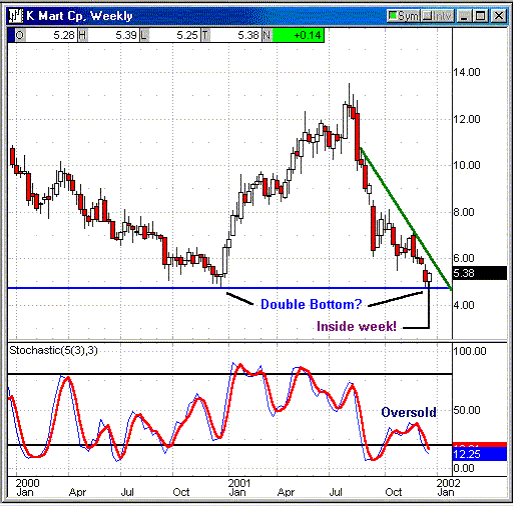
 Figure 3: Weekly Chart: KM Few established retailers have suffered more than Kmart in recent times and it's reflected in stock share price. After shedding over half the market cap value since mid-2001, price action recently bounced right off previous lows one year ago and posted a positive weekly close. Could this blue-light special offer great value to investors from here? More importantly to traders, it posted an inside week! Now we have a bounce from support, stochastic values in oversold extreme and price action coiled within the previous week's action. An upside break could offer potential profits ahead while a break below recent lows could open the doors to more lower prices to follow-- A risky stock at this point, and the more prudent trader would wait for the double bottom formation to begin its final leg upward before investing. Holiday retail sales results will be released to the public soon. Watching the various scenarios unfold in this sector may offer us some high-odds entry points to kick off our shopping for the New Year! |
Austin is a private trader who trades emini stock index futures intraday. He currently trades various futures markets from home in addition to managing a trader's educational forum
| Title: | Individual Trader |
| Company: | CoiledMarkets.com |
| Address: | PO Box 633 |
| Naples, NY 14512 | |
| Website: | coiledmarkets.com/blog |
| E-mail address: | austinp44@yahoo.com |
Traders' Resource Links | |
| CoiledMarkets.com has not added any product or service information to TRADERS' RESOURCE. | |
Click here for more information about our publications!
Comments
Date: 01/09/02Rank: 4Comment:

Request Information From Our Sponsors
- VectorVest, Inc.
- Executive Premier Workshop
- One-Day Options Course
- OptionsPro
- Retirement Income Workshop
- Sure-Fire Trading Systems (VectorVest, Inc.)
- Trading as a Business Workshop
- VectorVest 7 EOD
- VectorVest 7 RealTime/IntraDay
- VectorVest AutoTester
- VectorVest Educational Services
- VectorVest OnLine
- VectorVest Options Analyzer
- VectorVest ProGraphics v6.0
- VectorVest ProTrader 7
- VectorVest RealTime Derby Tool
- VectorVest Simulator
- VectorVest Variator
- VectorVest Watchdog
- StockCharts.com, Inc.
- Candle Patterns
- Candlestick Charting Explained
- Intermarket Technical Analysis
- John Murphy on Chart Analysis
- John Murphy's Chart Pattern Recognition
- John Murphy's Market Message
- MurphyExplainsMarketAnalysis-Intermarket Analysis
- MurphyExplainsMarketAnalysis-Visual Analysis
- StockCharts.com
- Technical Analysis of the Financial Markets
- The Visual Investor
