HOT TOPICS LIST
- MACD
- Fibonacci
- RSI
- Gann
- ADXR
- Stochastics
- Volume
- Triangles
- Futures
- Cycles
- Volatility
- ZIGZAG
- MESA
- Retracement
- Aroon
INDICATORS LIST
LIST OF TOPICS
PRINT THIS ARTICLE
by Austin Passamonte
When looking for an economic recovery, a good place to start is with big cap stocks. A quick look at some big cap charts may give a little insight into where the market (and economy) is headed.
Position: N/A
Austin Passamonte
Austin is a private trader who trades emini stock index futures intraday. He currently trades various futures markets from home in addition to managing a trader's educational forum
PRINT THIS ARTICLE
TECHNICAL ANALYSIS
Looking For Leadership
01/08/02 09:52:38 AMby Austin Passamonte
When looking for an economic recovery, a good place to start is with big cap stocks. A quick look at some big cap charts may give a little insight into where the market (and economy) is headed.
Position: N/A
| Market pundits are almost universal in their voice that the economy will recover in the year 2002 and likewise carry the stock market with it. Forecasts go from an immediate improvement to V-shaped recovery in the second half of next year. With the popular mantra being that the stock market is a forward-looking or anticipatory vehicle, wouldn't it make sense that such bullishness be reflected in the markets? We wonder how the big caps are spreading the tarot cards these days... |
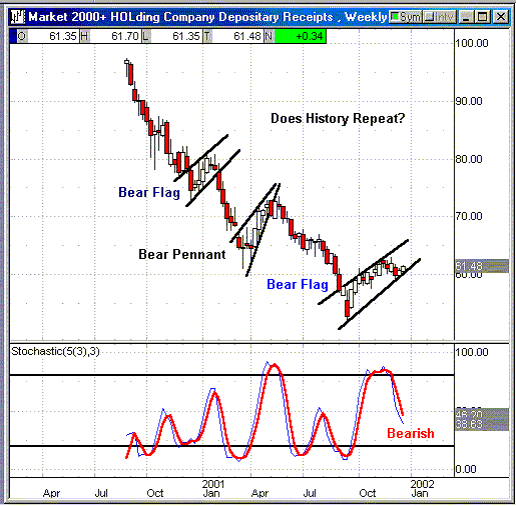
| Market 2000+ HOLDR shares are a compilation of 51 large-cap companies that trade on U.S. financial exchanges. Further details at: http://www.amex.com/structuredeq/holdrs_mkh.stm |

|
| Figure 1: Weekly Chart: Market 2000+ HOLDR |
| Graphic provided by: Quote.com. |
| Graphic provided by: QCharts. |
| |
| It stands to reason that this concentrated sector blends the industry giants and gives a look at near-term broad market bias. What do we see? An absence of bullishness right now. Since inception of the HOLDR back in mid-2000, three distinct bear flag patterns have formed and resulted in accurate forecast of lower price levels ahead. Presently we see price action finding support within an ascending channel dating from late September lows. Can it hold and turn higher? Lines drawn across the highs and lows of last eight candles (not shown) would show and eight-week bull flag forming, but stochastic values are still in full bearish decline. Watching for a break from this channel is one key indicating which direction market leadership is headed next. |
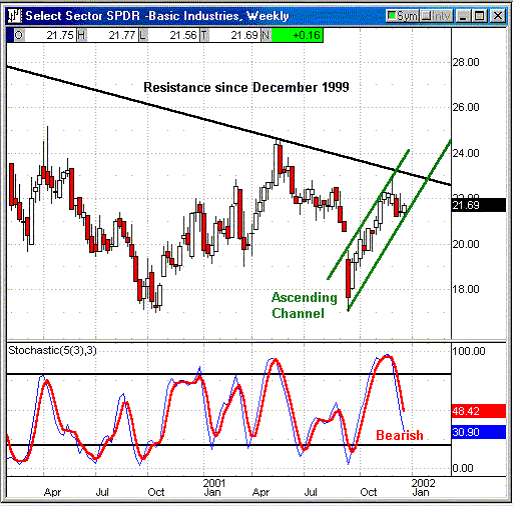
 Figure 2: Weekly Chart: XLB SPDR Another market forecast blend could be the Basic Industries SPYDR. All components are cyclical or deep cyclical companies that provide the building blocks of raw material for durable goods. If this is a consumer-led economy with hope to recover on the backs of their credit cards, shouldn't that begin with demand for material goods? Again, these economic stalwarts are climbing an ascending channel toward historical resistant. Stochastic values are still in full decline and could begin bullish reversal movement at any time, but watching for the inevitable resolution of that steep channel should help forecast how "The Market" predicts near-term market direction. |
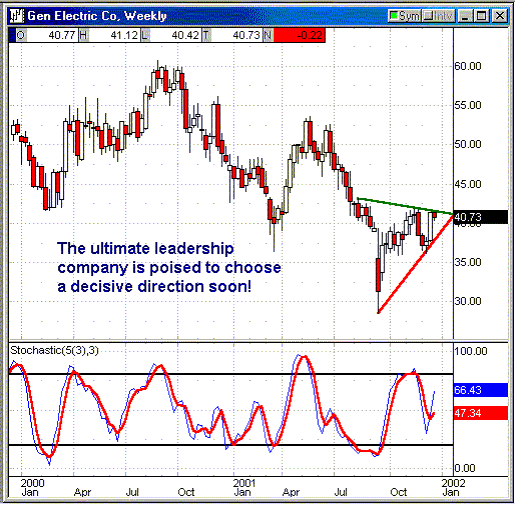
 Figure 3: Weekly Chart: GE Perhaps the ultimate market bellwether remains General Electric. Even when MSFT and CSCO repeatedly stumbled the past two years, mighty GE continues to plug away as the most well-run and diversified company in the world. Not to mention the largest! Price action has formed a defined wedge and presses resistance now as stochastic values begin to post a bullish reversal turn. Has the #1 company of all signaled what may follow suit across other sectors in domino effect? A weekly close above the $41 area above this current resistance might be our first indication ahead. When the general economy does begin to improve, we can be sure these stalwarts will signal us first. While it's true that small-cap issues usually outperform during initial market recovery, nothing moves higher with staying power unless large caps lead the way. |
Austin is a private trader who trades emini stock index futures intraday. He currently trades various futures markets from home in addition to managing a trader's educational forum
| Title: | Individual Trader |
| Company: | CoiledMarkets.com |
| Address: | PO Box 633 |
| Naples, NY 14512 | |
| Website: | coiledmarkets.com/blog |
| E-mail address: | austinp44@yahoo.com |
Traders' Resource Links | |
| CoiledMarkets.com has not added any product or service information to TRADERS' RESOURCE. | |
Click here for more information about our publications!
Comments
Date: 01/08/02Rank: 5Comment:
Date: 01/09/02Rank: 4Comment: Could you pl comment on why you use the candle stick chart instead of the bar chart? Do you think is is more meaningful?
zboroz@email.msn.com
Date: 01/13/02Rank: 5Comment:
Date: 01/16/02Rank: 5Comment:
Date: 01/24/02Rank: 5Comment:

Request Information From Our Sponsors
- StockCharts.com, Inc.
- Candle Patterns
- Candlestick Charting Explained
- Intermarket Technical Analysis
- John Murphy on Chart Analysis
- John Murphy's Chart Pattern Recognition
- John Murphy's Market Message
- MurphyExplainsMarketAnalysis-Intermarket Analysis
- MurphyExplainsMarketAnalysis-Visual Analysis
- StockCharts.com
- Technical Analysis of the Financial Markets
- The Visual Investor
- VectorVest, Inc.
- Executive Premier Workshop
- One-Day Options Course
- OptionsPro
- Retirement Income Workshop
- Sure-Fire Trading Systems (VectorVest, Inc.)
- Trading as a Business Workshop
- VectorVest 7 EOD
- VectorVest 7 RealTime/IntraDay
- VectorVest AutoTester
- VectorVest Educational Services
- VectorVest OnLine
- VectorVest Options Analyzer
- VectorVest ProGraphics v6.0
- VectorVest ProTrader 7
- VectorVest RealTime Derby Tool
- VectorVest Simulator
- VectorVest Variator
- VectorVest Watchdog
