HOT TOPICS LIST
- MACD
- Fibonacci
- RSI
- Gann
- ADXR
- Stochastics
- Volume
- Triangles
- Futures
- Cycles
- Volatility
- ZIGZAG
- MESA
- Retracement
- Aroon
INDICATORS LIST
LIST OF TOPICS
PRINT THIS ARTICLE
by David Penn
After a brutal, year long, 80% decline and an all-but-aborted merger with Hewlett-Packard, shares of Compaq look to rebound on their own.
Position: N/A
David Penn
Technical Writer for Technical Analysis of STOCKS & COMMODITIES magazine, Working-Money.com, and Traders.com Advantage.
PRINT THIS ARTICLE
DOUBLE BOTTOMS
Compaq's Double Bottom Breakout
12/05/01 04:10:19 PMby David Penn
After a brutal, year long, 80% decline and an all-but-aborted merger with Hewlett-Packard, shares of Compaq look to rebound on their own.
Position: N/A
| Is the bottom in tech stocks nigh? After a year and a half of declines in the Nasdaq and S&P 500, even proven technology companies like Compaq--with a hand in both the consumer and corporate computer technology markets--are rolling around on the canvas like felled prizefighters. Unlike prizefighters, however, stocks that spend a goodly amount of time on the metaphoric canvas can be valuable bets once they rise back to their feet and stalk back warily to the center of the ring. |
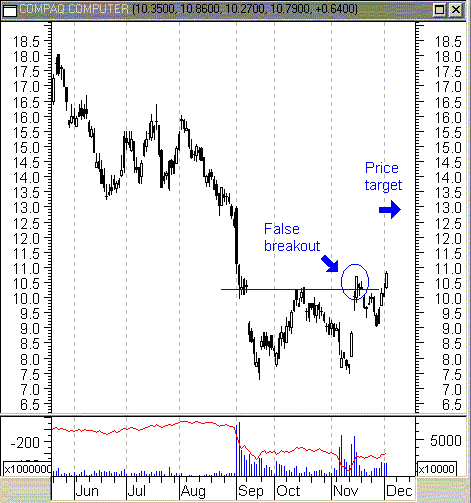
| In many ways, Compaq (CPQ) is just such a stock. Falling from a high of 35 in August 2000 to a low of 8 by the end of September 2001 (a drop of 80%), Compaq has spent much of the post-September 11th period in a powerful 50% rally. This rally has come in the form of a double bottom: a rally from an intermediate bottom followed by a correction weeks later that successfully tests the previous bottom, a formation that suggests a bullish reversal and higher prices to come. |

|
| A successful upside breakout from this double bottom could mean that the worst is over for Compaq. |
| Graphic provided by: MetaStock. |
| |
| Compaq's double bottom, coming at the end of months and months of declines, began with a big volume sell-off at the beginning of September. Shortly thereafter, prices gapped down from just over $10 to just under $9 by mid-month, and continued to decline until finally reaching a bottom low of $7.30 late in September. Shares of Compaq rallied from late September to mid-October. Unfortunately, as the chart shows, this rally was on declining volume, making it little surprise when the rally stalled out at resistance around 10.5. This area, $10.50, is also approximately where the gap down began. |
| Compaq resumed its downtrend in mid-October. However the lows put in back in mid-September afforded the stock some significant level of support as the correction was met with strong, high volume buying around 7.5. This buying was sufficient enough to send Compaq shares soaring upward early in November, with prices gapping up toward the previous resistance level of about 10.5. There appears to have been a false breakout on November 11th, but the correction from the false move was relatively slight as prices managed to remain above 9.00. The true breakout appears to have taken place at the beginning of December, with Compaq closing above 11 for the first time since early September. |
| Presently, Compaq looks as if it might retrace the losses from the huge volume sell-off days of late August. The measurement rule for double bottoms calls for the formation height (resistance or "neckline" to formation trough) to be added to the value at the resistance line. Such a measurement rule would provide for a price target of about 13, which would be near the area where CPQ sold off at the end of the summer. |
Technical Writer for Technical Analysis of STOCKS & COMMODITIES magazine, Working-Money.com, and Traders.com Advantage.
| Title: | Technical Writer |
| Company: | Technical Analysis, Inc. |
| Address: | 4757 California Avenue SW |
| Seattle, WA 98116 | |
| Phone # for sales: | 206 938 0570 |
| Fax: | 206 938 1307 |
| Website: | www.Traders.com |
| E-mail address: | DPenn@traders.com |
Traders' Resource Links | |
| Charting the Stock Market: The Wyckoff Method -- Books | |
| Working-Money.com -- Online Trading Services | |
| Traders.com Advantage -- Online Trading Services | |
| Technical Analysis of Stocks & Commodities -- Publications and Newsletters | |
| Working Money, at Working-Money.com -- Publications and Newsletters | |
| Traders.com Advantage -- Publications and Newsletters | |
| Professional Traders Starter Kit -- Software | |
Click here for more information about our publications!
PRINT THIS ARTICLE

|

Request Information From Our Sponsors
- StockCharts.com, Inc.
- Candle Patterns
- Candlestick Charting Explained
- Intermarket Technical Analysis
- John Murphy on Chart Analysis
- John Murphy's Chart Pattern Recognition
- John Murphy's Market Message
- MurphyExplainsMarketAnalysis-Intermarket Analysis
- MurphyExplainsMarketAnalysis-Visual Analysis
- StockCharts.com
- Technical Analysis of the Financial Markets
- The Visual Investor
- VectorVest, Inc.
- Executive Premier Workshop
- One-Day Options Course
- OptionsPro
- Retirement Income Workshop
- Sure-Fire Trading Systems (VectorVest, Inc.)
- Trading as a Business Workshop
- VectorVest 7 EOD
- VectorVest 7 RealTime/IntraDay
- VectorVest AutoTester
- VectorVest Educational Services
- VectorVest OnLine
- VectorVest Options Analyzer
- VectorVest ProGraphics v6.0
- VectorVest ProTrader 7
- VectorVest RealTime Derby Tool
- VectorVest Simulator
- VectorVest Variator
- VectorVest Watchdog
