HOT TOPICS LIST
- MACD
- Fibonacci
- RSI
- Gann
- ADXR
- Stochastics
- Volume
- Triangles
- Futures
- Cycles
- Volatility
- ZIGZAG
- MESA
- Retracement
- Aroon
INDICATORS LIST
LIST OF TOPICS
PRINT THIS ARTICLE
by David Penn
Believe it or not, but the first bear market of the 21st century is clawing along according to plan.
Position: N/A
David Penn
Technical Writer for Technical Analysis of STOCKS & COMMODITIES magazine, Working-Money.com, and Traders.com Advantage.
PRINT THIS ARTICLE
BULL/BEAR MARKET
Twenty-first Century Bear
08/16/01 04:03:09 PMby David Penn
Believe it or not, but the first bear market of the 21st century is clawing along according to plan.
Position: N/A
| Whether you feel that the 21st century began at the end of 1999 or the end of 2000, there is no disputing the fact that the market of the new millennium is a bearish one. And while frustrated traders and investors both lament the recently-ended, record-breaking bull market and wait restlessly for its resurgence, the fact of the matter is that the bear market we confront is amazingly typical of bear markets as characterized by a number of Dow Theorists and technical analysts. |
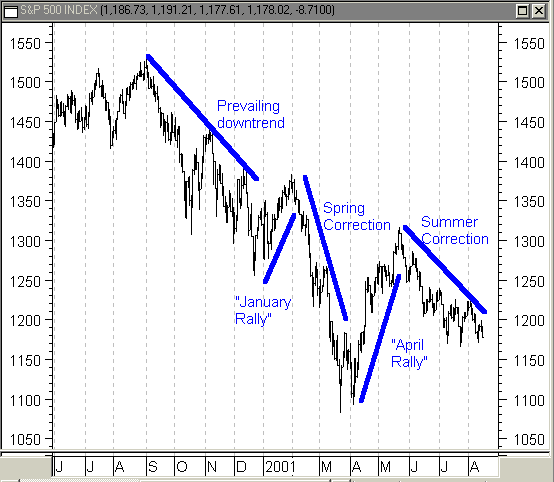
| This typical characterization consists of a series of moves and counter-moves, or trends and counter-trends, with an initial prevailing downward trend being met with a rally, which is corrected. A second rally, often more powerful than the first rally, tends to follow this first correction. But following the second rally is often a major correction that anticipates either a resumption of the prevailing trend (downward, in this case) or a bottoming and reversal. |

|
| Figure 1: Five ways of moving through a downtrend. Note how the January and April rallies do not prevent the S&P 500 from making lower lows. |
| Graphic provided by: MetaStock. |
| |
| The bear market in the S&P 500 has very much followed this pattern. The prevailing downtrend begins in September 2000 and continues to the trough at the end of the year. The January 2001 rally marks the temporary interruption of the downtrend. From February through March, the S&P 500 sold off, representing a correction from the January advance. The April rally, which lasted into May, represented the more sizable bear market rally of the two. Yet, that rally too failed in June, a downward correction that continues. |
| While there are a number of rallies during the prevailing downtrend, for example, what distinguishes both the January and April rallies is the way they break out above trendlines, forcing the falling S&P 500 to take a less severe trajectory. Such trendline breakouts, obviously, do not necessarily signify a change in trend. But they are effective watermarks when measuring the market. For example, when the January rally broke out above the previous downtrend, and then slipped back beneath the trendline, further declines could have been anticipated. |
| For those who may feel as if they have missed, essentially, five different trending markets, there may be a caveat. At the end of the second correction, a new series of trends and counter-trends is anticipated. Of course, the specific direction of the move cannot be derived necessarily from the previous series of moves or the prevailing trend. But the end of the second correction, now extending into August, does suggest that opportunity--long, short or cash--is not far away. After months of meandering through the summer, traders and investors are likely to be grateful for whatever guiding light they get. |
Technical Writer for Technical Analysis of STOCKS & COMMODITIES magazine, Working-Money.com, and Traders.com Advantage.
| Title: | Technical Writer |
| Company: | Technical Analysis, Inc. |
| Address: | 4757 California Avenue SW |
| Seattle, WA 98116 | |
| Phone # for sales: | 206 938 0570 |
| Fax: | 206 938 1307 |
| Website: | www.Traders.com |
| E-mail address: | DPenn@traders.com |
Traders' Resource Links | |
| Charting the Stock Market: The Wyckoff Method -- Books | |
| Working-Money.com -- Online Trading Services | |
| Traders.com Advantage -- Online Trading Services | |
| Technical Analysis of Stocks & Commodities -- Publications and Newsletters | |
| Working Money, at Working-Money.com -- Publications and Newsletters | |
| Traders.com Advantage -- Publications and Newsletters | |
| Professional Traders Starter Kit -- Software | |
Click here for more information about our publications!
Comments

|

Request Information From Our Sponsors
- StockCharts.com, Inc.
- Candle Patterns
- Candlestick Charting Explained
- Intermarket Technical Analysis
- John Murphy on Chart Analysis
- John Murphy's Chart Pattern Recognition
- John Murphy's Market Message
- MurphyExplainsMarketAnalysis-Intermarket Analysis
- MurphyExplainsMarketAnalysis-Visual Analysis
- StockCharts.com
- Technical Analysis of the Financial Markets
- The Visual Investor
- VectorVest, Inc.
- Executive Premier Workshop
- One-Day Options Course
- OptionsPro
- Retirement Income Workshop
- Sure-Fire Trading Systems (VectorVest, Inc.)
- Trading as a Business Workshop
- VectorVest 7 EOD
- VectorVest 7 RealTime/IntraDay
- VectorVest AutoTester
- VectorVest Educational Services
- VectorVest OnLine
- VectorVest Options Analyzer
- VectorVest ProGraphics v6.0
- VectorVest ProTrader 7
- VectorVest RealTime Derby Tool
- VectorVest Simulator
- VectorVest Variator
- VectorVest Watchdog
