HOT TOPICS LIST
- MACD
- Fibonacci
- RSI
- Gann
- ADXR
- Stochastics
- Volume
- Triangles
- Futures
- Cycles
- Volatility
- ZIGZAG
- MESA
- Retracement
- Aroon
INDICATORS LIST
LIST OF TOPICS
PRINT THIS ARTICLE
by Dennis D. Peterson
This article is reprinted from Stocks & Commodities V. 10:12 (501-506) as a supplement to Dennis Peterson's April 27, 2001 article "Stochastics." Here's an example on how to calculate stochastics using Microsoft Excel.
Position: N/A
Dennis D. Peterson
Market index trading on a daily basis.
PRINT THIS ARTICLE
STOCHASTICS
Calculating Stochastics
06/05/01 02:40:36 PMby Dennis D. Peterson
This article is reprinted from Stocks & Commodities V. 10:12 (501-506) as a supplement to Dennis Peterson's April 27, 2001 article "Stochastics." Here's an example on how to calculate stochastics using Microsoft Excel.
Position: N/A
| The stochastics indicator calculates the relative level of today's closing price to the trading range selected by the user. Two lines are calculated, %K, which is: %K=100((Current Close-Lowest Lown) / (Highest Highn- Lowest Lown)) This is the raw value of the stochastics indicator. The n period is the number of lookback days selected by the user, such as 10 days.  |
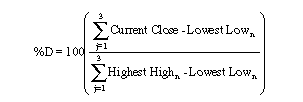
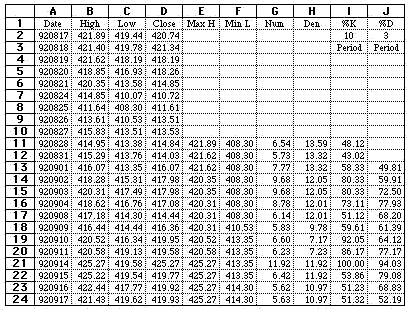
| %D is a smoothed %K. The above example smoothes the %K by calculating the ratio of the summed last three periods of the numerator of %K to the summed last three periods of the denominator of %K. In Article Figure 1, a 10-period %K and a three-period %D are presented. Column E is the highest high in the last 10 days. The formula for cell E24 is: =MAX(B15:B24) Column F is the lowest low in the last 10 days. The formula for cell for F24 is: =MIN(C15:C24) The numerator for %K is Column G. The formula for cell for G24 is: =D24 - F24 |

|
| Article Figure 1: Calculating stochastics using Excel. |
| Graphic provided by: Microsoft Excel. |
| |
| The denominator for %K is Column H. The formula for cell for H24 is: =E24 - F24 %K is calculated in column I. The formula for cell I24 is: =100*(G24/H24) Finally, %D is calculated in column J. The formula for J24 is: =100*(SUM(G22:G24)/SUM(H22:H24)) The slow version of the stochastics indicator takes these steps to calculate the value of %D and then relabels %D as slow %K, then smoothes the slow %K with a three-day moving average for the %D. -- Written for Stocks & Commodities magazine by Thom Hartle This article is reprinted from Stocks & Commodities V. 10:12 (501-506) as a supplement to Dennis Peterson's April 27, 2001 article "Stochastics." |
Market index trading on a daily basis.
| Title: | Staff Writer |
| Company: | Technical Analysis, Inc. |
| Address: | 4757 California Ave SW |
| Seattle, WA 98116-4499 | |
| Phone # for sales: | 206 938 0570 |
| Fax: | 206 938 1307 |
| Website: | www.traders.com |
| E-mail address: | dpeterson@traders.com |
Traders' Resource Links | |
| Charting the Stock Market: The Wyckoff Method -- Books | |
| Working-Money.com -- Online Trading Services | |
| Traders.com Advantage -- Online Trading Services | |
| Technical Analysis of Stocks & Commodities -- Publications and Newsletters | |
| Working Money, at Working-Money.com -- Publications and Newsletters | |
| Traders.com Advantage -- Publications and Newsletters | |
| Professional Traders Starter Kit -- Software | |
Click here for more information about our publications!
Comments
Date: 10/15/01Rank: 1Comment: I need simplicity in my life not complexity to judge whether or not to consider purchase of a stock.At age 70 I do not need all this mathmatical, algebraic etc,etc, computation to work with. I just need a few simple facts /or comments as to why a certain stock should be considerd.This is great for the college,M.B.A.,econ majors but not this lady. Thank you very much.

Request Information From Our Sponsors
- StockCharts.com, Inc.
- Candle Patterns
- Candlestick Charting Explained
- Intermarket Technical Analysis
- John Murphy on Chart Analysis
- John Murphy's Chart Pattern Recognition
- John Murphy's Market Message
- MurphyExplainsMarketAnalysis-Intermarket Analysis
- MurphyExplainsMarketAnalysis-Visual Analysis
- StockCharts.com
- Technical Analysis of the Financial Markets
- The Visual Investor
- VectorVest, Inc.
- Executive Premier Workshop
- One-Day Options Course
- OptionsPro
- Retirement Income Workshop
- Sure-Fire Trading Systems (VectorVest, Inc.)
- Trading as a Business Workshop
- VectorVest 7 EOD
- VectorVest 7 RealTime/IntraDay
- VectorVest AutoTester
- VectorVest Educational Services
- VectorVest OnLine
- VectorVest Options Analyzer
- VectorVest ProGraphics v6.0
- VectorVest ProTrader 7
- VectorVest RealTime Derby Tool
- VectorVest Simulator
- VectorVest Variator
- VectorVest Watchdog
