

HOT TOPICS LIST
- MACD
- Fibonacci
- RSI
- Gann
- ADXR
- Stochastics
- Volume
- Triangles
- Futures
- Cycles
- Volatility
- ZIGZAG
- MESA
- Retracement
- Aroon
INDICATORS LIST
LIST OF TOPICS
PRINT THIS ARTICLE
by Dennis D. Peterson
There is the right time to use stochastic and there are also alternatives.
Position: N/A
Dennis D. Peterson
Market index trading on a daily basis.
PRINT THIS ARTICLE
STOCHASTICS
Stochastic
04/27/01 04:26:00 PMby Dennis D. Peterson
There is the right time to use stochastic and there are also alternatives.
Position: N/A
| The notion behind the stochastic oscillator is sound. As a stock or commodity rises (or declines), today's close is likely to be higher (or lower) than those in the past. The only problem is that stocks and commodities don't go straight up or down; there are nagging bumps along the road called consolidations or continuation patterns. Those bumps mean that you need to know how to analyze momentum, because that's what the stochastic oscillator measures. The formula for a stochastic without any smoothing, called %K, is %K=100 * (close-lowest low)/(highest high-lowest low), where the close is for the current day and the lowest low or high is the lowest low price, or highest high price, seen over the last K periods. You choose how long a period you want to look back (K). Obviously, you can choose daily, weekly, or monthly data. The range of prices is created in the denominator. So %K is betting that as prices move towards a peak the current closes in price will be in the upper portion of the range. Similarly, as prices move towards a bottom, the closes will be in the lower range. |
| %K without any smoothing is a bit noisy. Values of %K jump around a bit. Take one guess as to what is chosen to smooth out the noise. If you said, use a moving average you're right. In the above formula you now substitute every item with a simple moving average using a different period than K. Call it FK, for fast %K. For close, substitute the simple moving average of closes over the last FK periods. For lowest low, you still look K periods back to find the lowest low, but now use a moving average of FK periods of the lowest lows. Do the same for the highest high. The numerator of the formula illustrates the technique: fast %K numerator= simple moving average of price closes over the last FK periods - simple moving average over the last FK periods (lowest low value of K periods) This final -- well almost final -- product is called the fast stochastic. To get fast %K, I have introduced a lag by taking a moving average of %K values. As you may know, there is a signal line associated with %K, usually shown as a dashed line. Again, one guess as to how that is created. Right again. Take the moving average of fast %K. This is called the slow stochastic and is often shown as %D. Some software lets you choose all three parameters, the look-back period K, the period for the moving average of the values in the look-back period, and the period for the signal line. The technique to create a signal line for the fast %K is the same as the one used for MACD. MACD is the price oscillator and the moving average of the price oscillator. The moving average of the price oscillator is the signal line. Thus, it's the same technique as stochastic for creating a signal line. MACD gets its momentum by measuring price at two different points in time by taking the difference of two different moving averages. A moving average of 10 days, for example, will have more recent data than, than a moving average of 20 days. Stochastic gets its momentum by measuring where price today fits with the range of prices over the recent past period. The same principal is used for both MACD and stochastic. Make comparisons over time to create an oscillator. |
|
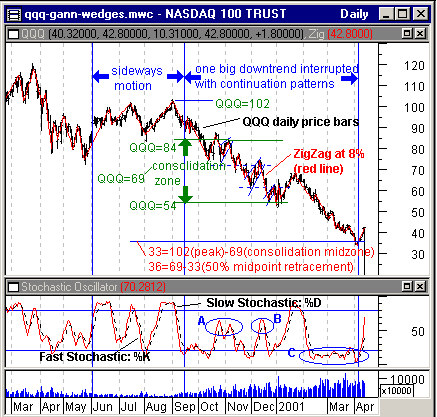
| Figure 1: The top chart shows QQQ annotated with resistance support analysis and ZigZag at 8%. The bottom chart is the Stochastic for QQQ. |
| Graphic provided by: MetaStock. |
| Graphic provided by: Data vendor: eSignal<. |
| |
| In Figure 1, I have labeled fast %K as the "Fast Stochastic: %K." You will often see just %K when using software programs or websites. Instead of the formula I gave at the beginning, software programs and websites often use the one described as fast %K. I have created all three separately for my own use - in other words, I can change any of the parameters, including whether I want to use a simple versus exponential moving average for fast %K. So be aware that you are may be looking at a fast %K when you see %K on a website, and that it has some lag. The moving average of fast %K is labeled as "Slow Stochastic: %D." I have separated QQQ into two large sections and labeled them as "sideways motion" and "one big downtrend interrupted with continuation patterns." The three characteristics of oscillators is that they can show divergences and overbought/oversold conditions and the crossing of a middle value of an oscillator can mean a change in momentum. The stochastic shown at the bottom of Figure 1 uses a 14-day look-back period, five-day period for the moving average of look-back values and a five-day signal line. The first thing you might notice is that stochastic does reach overbought and oversold thresholds as shown by %K going above 80 and below 30 when QQQ is going sideways (portion of Figure 1 labeled as "sideways motion"). But also notice that the swing points (red line overlaid on QQQ price chart using 8% ZigZag) identified the same price reversals. However there is that troublesome little dip of the stochastic at the beginning of July 2000 that doesn't cross a threshold. Enter rule 1 -- take the trade when the price confirms an upswing. If your setup rule is that %K is greater than %D and your entry rule is that price closes higher you are back in the market long. You might also require through some independent means, such as the 52-week high/(high+low) ratio to confirm that this is not a bear market - a little bullish to full bull should be ok. Now the big downtrend starts (portion of Figure 1 labeled as "one big...patterns"). Stochastics is hanging on the bottom threshold for dear life. With your setup in place you shouldn't have to worry. Without both your setup and entry rules, if you want to go long, you would be in at point A. Point A is one of those nasty little rising wedges causing a bump in your equity if you are going long. You'll get caught again at point B. Finally, at the end of 2000, you are in long again and can ride QQQ up through part of January 2001 - if you still trust stochastic and get in. So how do you read momentum? Not in a vacuum. If you were trading swings, you would have done better. To correctly interpret stochastic momentum you need to understand the underlying price pattern behavior if you are in a trend. But then why use stochastic? To illustrate the point, I'll compare how $1,000 in equity would grow if you went long after a swing valley is encountered and went short after a swing peak is encountered, by comparing today's close to closes up to three days ago to define swing valleys and peaks. I will also require for entry that today's close be greater than yesterday's. I will go long if it is valley and go short if it is peak, and I require that at least a 5% change occur in closing prices (ZigZag at 8% in Figure 1 illustrates the point). I'll compare that equity growth against the equity growth using stochastic, with the rule to go long if fast %K is greater than %D and short if %K fast is less than %D - in other words, go long if fast %K is above its signal line and go short if fast %K is below its signal line. I also will enter long or short the day after the condition for entry is true and enter short the day after as well. After the initial system testing was done, I could see that using swing peaks and valleys always caught the trend. However, it performed poorly in chop, some of which occurs in the downtrend that starts after September 1, 2000. I wanted a test that would tell me if I was in a downtrend. The easiest one for me to mechanize, was to use the ratio of 52-week new highs and lows (highs/ (highs+lows)). This is probably one of the times when it is easier and better to visually determine downtrend. |
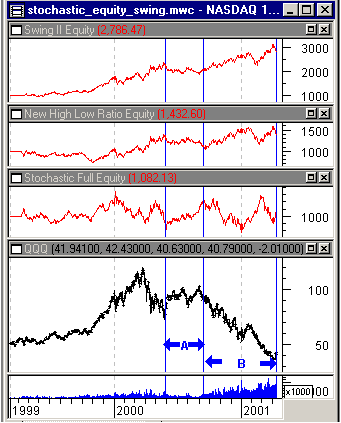 Figure 2: Top chart is equity growth using swing peaks and valleys with a setup using the ratio of new highs and lows to indicate bull versus bear market. Second chart from the top is equity growth using the ratio of new highs and lows alone. The second chart from the bottom is equity growth using stochastic, and the bottom chart is QQQ price bars with volume. The figure is annotated with two vertical lines to match areas of interest of Figure 1. So how did these two systems do? Given the discussion, I think about what you would expect. Stochastics (Figure 2: second chart from bottom) did better than the ratio of new highs/lows and swing with new highs/lows (Figure 2: top and second charts from top, respectively) during period A, but then stochastics faired worse afterwards during period B. Overall, swings using new highs and lows did best, and did better than using new highs and lows alone. When you look at these two equity charts you need to ask yourself - should I try and improve my performance with stochastics or using swings? Optimizing a marginally performing system to fit the moment is not recommended. The market is a ruthless adversary and is seldom cooperative. You are better off improving a sound system than crutching up a poor one. If I had used ZigZag I would have seen $1,000 grow to over $20,000, and while this is a bit misleading since ZigZag knows from history where to draw the valleys and peaks, it still shows the potential of using swings. Charlie F. Wright has two rules that you might want to consider: "1. Prices should confirm the direction indicated by the set-up, before taking a position. 2. The entry should guarantee that a system will capture every price move for which it is designed." The swing strategy did catch every uptrend and downtrend, so rule 2 was followed. The best I could do for swing set-up was to use a ratio of 52-week highs and lows. I required that today's close be greater than yesterday's to assist with rule 2. Suppose I had visually determined the trend direction, rather than with the indicator I built (a type of RSI indicator of new highs and lows), I would have essentially traded without an indicator. I would have been looking for swing peaks and valleys. What I am suggesting is that there are alternatives to trading the market some of which don't use indicators, or at the very least use rather simple forms of them. It just depends on how you analyze price action. With more understanding you might adopt the principle of KISS (keep it simple stupid). For additional reading, click here for an article on using Excel to calculate the stochastic indicator. |
Market index trading on a daily basis.
| Title: | Staff Writer |
| Company: | Technical Analysis, Inc. |
| Address: | 4757 California Ave SW |
| Seattle, WA 98116-4499 | |
| Phone # for sales: | 206 938 0570 |
| Fax: | 206 938 1307 |
| Website: | www.traders.com |
| E-mail address: | dpeterson@traders.com |
Traders' Resource Links | |
| Charting the Stock Market: The Wyckoff Method -- Books | |
| Working-Money.com -- Online Trading Services | |
| Traders.com Advantage -- Online Trading Services | |
| Technical Analysis of Stocks & Commodities -- Publications and Newsletters | |
| Working Money, at Working-Money.com -- Publications and Newsletters | |
| Traders.com Advantage -- Publications and Newsletters | |
| Professional Traders Starter Kit -- Software | |
Click here for more information about our publications!
Comments
Date:�05/01/01Rank:�5Comment:�
Date:�05/23/01Rank:�5Comment:�

Request Information From Our Sponsors
- StockCharts.com, Inc.
- Candle Patterns
- Candlestick Charting Explained
- Intermarket Technical Analysis
- John Murphy on Chart Analysis
- John Murphy's Chart Pattern Recognition
- John Murphy's Market Message
- MurphyExplainsMarketAnalysis-Intermarket Analysis
- MurphyExplainsMarketAnalysis-Visual Analysis
- StockCharts.com
- Technical Analysis of the Financial Markets
- The Visual Investor
- VectorVest, Inc.
- Executive Premier Workshop
- One-Day Options Course
- OptionsPro
- Retirement Income Workshop
- Sure-Fire Trading Systems (VectorVest, Inc.)
- Trading as a Business Workshop
- VectorVest 7 EOD
- VectorVest 7 RealTime/IntraDay
- VectorVest AutoTester
- VectorVest Educational Services
- VectorVest OnLine
- VectorVest Options Analyzer
- VectorVest ProGraphics v6.0
- VectorVest ProTrader 7
- VectorVest RealTime Derby Tool
- VectorVest Simulator
- VectorVest Variator
- VectorVest Watchdog