HOT TOPICS LIST
- MACD
- Fibonacci
- RSI
- Gann
- ADXR
- Stochastics
- Volume
- Triangles
- Futures
- Cycles
- Volatility
- ZIGZAG
- MESA
- Retracement
- Aroon
INDICATORS LIST
LIST OF TOPICS
PRINT THIS ARTICLE
by David Penn
An ascending triangle interrupts a year's worth of advances. Will further bullishness follow?
Position: N/A
David Penn
Technical Writer for Technical Analysis of STOCKS & COMMODITIES magazine, Working-Money.com, and Traders.com Advantage.
PRINT THIS ARTICLE
TRIANGLES
Fifth Third Bancorp's Ascending Triangle
05/09/01 11:49:08 AMby David Penn
An ascending triangle interrupts a year's worth of advances. Will further bullishness follow?
Position: N/A
| I won't lie. I started looking at Fifth Third Bancorp (FITB) after reviewing BARRON's list of the 500 best performing companies for shareholders over the past three years. In a market as decidely undecided as this one, I wanted to see how some of the companies who were doing best by their shareholders were holding up. In other words, fundamentally speaking, companies like FITB are kicking tail and taking names, as they say. But how do their charts measure up? |
| Not only did FITB's chart look interesting, but also I suspected that the interest rate cutting mission the Federal Reserve has embarked on with the coming of the new millennium might disproportionately benefit the better banks and related financials. I still think the charts tell no lies, but if there is a fundamental kicker to act as a catalyst to price behavior, I'm all for including it. |

|
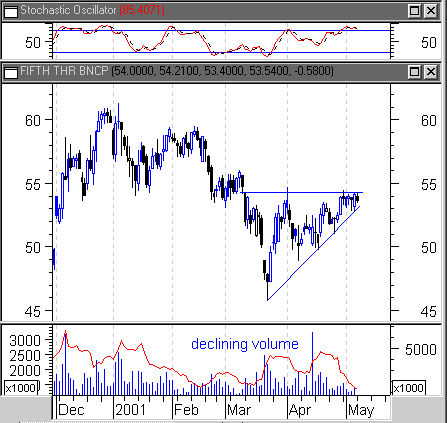
| Declining volume is also a characteristic of ascending triangles. |
| Graphic provided by: MetaStock. |
| |
| For background, FITB has been enjoying a bull market since the mid-1990s. Shares reached a peak in the upper forties in 1999 and the stock went into a year-long consolidation pattern with a mildly negative bias. That negativity broke early in 2000, with shares falling as low as $29. This correction provided the impetus for FITB's strong advance through 2000 (a high of 60 on the last trading day of the year). Unfortunately, 2001 has taken its toll on FITB, with shares shrinking back between 45 and 55 for most of the year. But as the spring unfolded, shares of FITB began to move up. While prices from March through April met stiff resistance just north of 54, the lows were consecutively higher: the March low was 45, the lows in April were 48, then 49, then 51 late in the month. The low for May as of this writing is 52.76. |
| This combination of higher lows and steady highs is characteristic of the ascending triangle formation, a bullish chart pattern that is most promising when appearing at the tail end of a price advance. Here, while there is an intermediate-to-short downtrend leading into the ascending triangle (essentially, the February move), the long-to-intermediate trend is clearly up--as suggested above. Insofar as the ascending triangle suggests bullish consolidation, FITB may be expected to resume its advance with an upside breakout in May. |
| Ascending triangles can be tricky formations. They are prone to both premature breakouts and throwbacks, according to Bulkowski, and premature breakouts, throwbacks and the real breakout all can occur on heavy volume. This suggests keeping stops as tight as necessary, but also that traders leave plenty of room in the event of whipsawing. The measure rule for ascending triangles is commonsensical. Add the formation height to the value of the horizontal trend line to get an upside price objective. Here, a formation height of about 8 (54 minus 46) added to the value of the horizontal trend line 954) provides for an upside price objective of 62--just enough for FITB to record a new all-time high. |
Technical Writer for Technical Analysis of STOCKS & COMMODITIES magazine, Working-Money.com, and Traders.com Advantage.
| Title: | Technical Writer |
| Company: | Technical Analysis, Inc. |
| Address: | 4757 California Avenue SW |
| Seattle, WA 98116 | |
| Phone # for sales: | 206 938 0570 |
| Fax: | 206 938 1307 |
| Website: | www.Traders.com |
| E-mail address: | DPenn@traders.com |
Traders' Resource Links | |
| Charting the Stock Market: The Wyckoff Method -- Books | |
| Working-Money.com -- Online Trading Services | |
| Traders.com Advantage -- Online Trading Services | |
| Technical Analysis of Stocks & Commodities -- Publications and Newsletters | |
| Working Money, at Working-Money.com -- Publications and Newsletters | |
| Traders.com Advantage -- Publications and Newsletters | |
| Professional Traders Starter Kit -- Software | |
Click here for more information about our publications!
Comments

Request Information From Our Sponsors
- StockCharts.com, Inc.
- Candle Patterns
- Candlestick Charting Explained
- Intermarket Technical Analysis
- John Murphy on Chart Analysis
- John Murphy's Chart Pattern Recognition
- John Murphy's Market Message
- MurphyExplainsMarketAnalysis-Intermarket Analysis
- MurphyExplainsMarketAnalysis-Visual Analysis
- StockCharts.com
- Technical Analysis of the Financial Markets
- The Visual Investor
- VectorVest, Inc.
- Executive Premier Workshop
- One-Day Options Course
- OptionsPro
- Retirement Income Workshop
- Sure-Fire Trading Systems (VectorVest, Inc.)
- Trading as a Business Workshop
- VectorVest 7 EOD
- VectorVest 7 RealTime/IntraDay
- VectorVest AutoTester
- VectorVest Educational Services
- VectorVest OnLine
- VectorVest Options Analyzer
- VectorVest ProGraphics v6.0
- VectorVest ProTrader 7
- VectorVest RealTime Derby Tool
- VectorVest Simulator
- VectorVest Variator
- VectorVest Watchdog
