HOT TOPICS LIST
- MACD
- Fibonacci
- RSI
- Gann
- ADXR
- Stochastics
- Volume
- Triangles
- Futures
- Cycles
- Volatility
- ZIGZAG
- MESA
- Retracement
- Aroon
INDICATORS LIST
LIST OF TOPICS
PRINT THIS ARTICLE
by Dr. Michael J. Seiler
Will the MACD indicator improve results? So far the RSI oscillator and the Parabolic trading systems have been flawed.
Position: N/A
Dr. Michael J. Seiler
PRINT THIS ARTICLE
MACD
Using Technical Analysis to Manage a REIT Portfolio Part III -- MACD
02/14/01 10:26:51 AMby Dr. Michael J. Seiler
Will the MACD indicator improve results? So far the RSI oscillator and the Parabolic trading systems have been flawed.
Position: N/A
| MACD Moving Average Crossover Divergence (MACD) is a lagging indicator, meaning that it identifies a trend or trend reversal after they have begun. It works equally well in trending or non-trending markets. MACD consists of three exponentially smoothed moving averages: fast (12 days), slow (26 days), and a trigger or signal indicator (9 days). The formula is as follows:  where, MAt = the moving average value for the current period, MAt-1 = the moving average value for the previous period, n = the number of periods considered in the moving average. After plugging in the three different values of "n" (9, 12 and 26), three resulting moving averages are calculated. When the difference between the slow and fast moving average crosses the trigger or signal indicator from the bottom, a buy signal is generated. When the difference between the slow and fast moving average crosses the trigger from the top, a sell signal is generated. The EasyLanguage code for MACD is provided at the end of Part III. |
| REIT DATA AND RESULTS All data are end-of-day, provided by Bonneville Market Information. |

|
| |
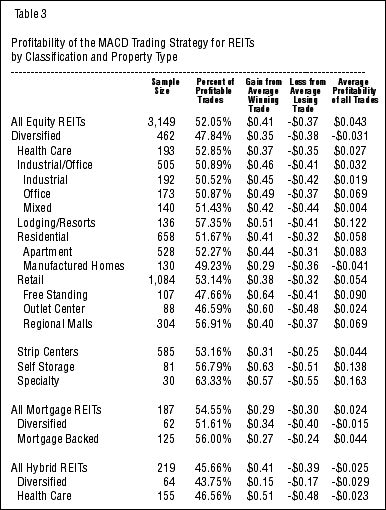
| The overall results for Equity REITs are similar to those of the RSI Oscillator. Although the average gains and losses are not as large as the RSI Oscillator, the net gains remain at roughly the same level. Moreover, the MACD system is profitable the majority of the time in seven of the eight Equity REIT property types and six of the nine sub-property types. Unlike the results from RSI and Parabolic, Mortgage REITs were traded for a profit even though the sub-property type, Diversified, results were still negative. For the Hybrid REITs, the MACD trading system did not generate a profit even though the results were much improved over the two other strategies. |
| CONCLUSION The RSI oscillator and MACD systems generated a sufficient profit when applied to equity REITs. The third, parabolic, was unsuccessful. When the three strategies were applied to mortgage REITs, only MACD was successful and even these results were not convincing for all property types. Finally, all three technical analysis techniques were unable to generate a profit for hybrid REITs. This was also the case at the sub-property level. In sum, technical analysis based trading systems can be used to profitably trade a portfolio of equity REITs. However, although I demonstrated the effectiveness of two strategies, there are an infinite combination of trading techniques and system inputs that can be tested. Therefore, while I have shown that technical analysis can be used to trade REITs, I do not presume to have identified the most effective trading system possible. |
| MACD Code Construction with EasyLanguage I. Function Inputs: Price(NumericSeries), FastMA(NumericSimple), SlowMA(NumericSimple); MACD = XAverage(Price, FastMA) - XAverage(Price, SlowMA); II. Indicator Inputs: FastMA(12), SlowMA(26), MacdMA(9); Plot1(MACD(Close, FastMA, SlowMA), "MACD"); Plot2(XAverage(MACD(Close, FastMA, SlowMA), MacdMA), "MACDAvg"); Plot3(Plot1 - Plot2, "MADiff"); {Alert Criteria} If Plot3 Crosses Over 0 Then
Else
III. Bullish Signal If CurrentBar > 2 AND MACD(Close, FastMovAvg, SlowMovAvg) Crosses Above XAverage(MACD(Close, FastMovAvg, SlowMovAvg), MACDMovAvg)[1] Then
IV. Bearish Signal If CurrentBar > 2 AND MACD(Close, FastMovAvg, SlowMovAvg) Crosses Below XAverage(MACD(Close, FastMovAvg, SlowMovAvg), MACDMovAvg)[1] Then
Part I - The RSI Oscillator Part II - The Parabolic |
| Title: | Professor of Finance |
| Company: | Hawaii Pacific University |
| Address: | 1132 Bishop Street; Suite 504 |
| Honolulu, HI 96813 | |
| Phone # for sales: | 808-544-0827 |
| Fax: | 808-544-0835 |
| E-mail address: | mseiler@hpu.edu |
Traders' Resource Links | |
| Hawaii Pacific University has not added any product or service information to TRADERS' RESOURCE. | |
Click here for more information about our publications!
Comments
Date: 02/15/01Rank: 4Comment:
Date: 02/20/01Rank: 5Comment: I like the professional-like format of all three articles by the author. More of the same or similar please.

|

Request Information From Our Sponsors
- StockCharts.com, Inc.
- Candle Patterns
- Candlestick Charting Explained
- Intermarket Technical Analysis
- John Murphy on Chart Analysis
- John Murphy's Chart Pattern Recognition
- John Murphy's Market Message
- MurphyExplainsMarketAnalysis-Intermarket Analysis
- MurphyExplainsMarketAnalysis-Visual Analysis
- StockCharts.com
- Technical Analysis of the Financial Markets
- The Visual Investor
- VectorVest, Inc.
- Executive Premier Workshop
- One-Day Options Course
- OptionsPro
- Retirement Income Workshop
- Sure-Fire Trading Systems (VectorVest, Inc.)
- Trading as a Business Workshop
- VectorVest 7 EOD
- VectorVest 7 RealTime/IntraDay
- VectorVest AutoTester
- VectorVest Educational Services
- VectorVest OnLine
- VectorVest Options Analyzer
- VectorVest ProGraphics v6.0
- VectorVest ProTrader 7
- VectorVest RealTime Derby Tool
- VectorVest Simulator
- VectorVest Variator
- VectorVest Watchdog
