HOT TOPICS LIST
- MACD
- Fibonacci
- RSI
- Gann
- ADXR
- Stochastics
- Volume
- Triangles
- Futures
- Cycles
- Volatility
- ZIGZAG
- MESA
- Retracement
- Aroon
INDICATORS LIST
LIST OF TOPICS
PRINT THIS ARTICLE
by Dr. Michael J. Seiler
Does the Parabolic technical trading system work in a trending market?
Position: N/A
Dr. Michael J. Seiler
PRINT THIS ARTICLE
WILDER'S PARA SAR
Using Technical Analysis to Manage a REIT Portfolio Part II -- Parabolic
02/14/01 10:27:49 AMby Dr. Michael J. Seiler
Does the Parabolic technical trading system work in a trending market?
Position: N/A
| The Parabolic trading system, so named because of the shape that results when the system is applied to a chart, is designed for use in trending markets. Once a trend has begun, the system allows for moderate anti-trend movements, but as the trend matures, the system's protective trailing stop (referred to as "stop-and-reverse (SAR)") follows the price movements at a progressively closer rate. Once the SAR is reached, an equal and opposite position is taken in the market. In fact, the Parabolic trading system always has you in the market with either a long or short position. The calculations for the Parabolic trading system are as follows: SARbuy = SAR-1 + AF(Low - SAR-1) SARsell = SAR-1 + AF(High - SAR-1) where, SAR-1 = Stop-and-reverse value from the previous price, SARbuy = Stop-and-reverse price on the buy side, SARsell = Stop-and-reverse price on the sell side, High = the highest price since the initial position has been taken, Low = the lowest price since the initial position has been taken, AF = an acceleration factor. The EasyLanguage code for the Parabolic trading system is posted at the end of Part II. |
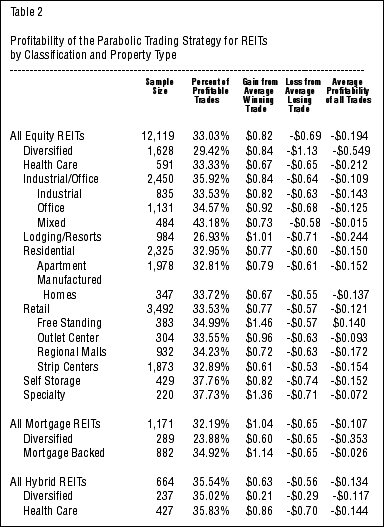
| DATA AND RESULTS As in Part I, I've used all 210 REITs in existence, dividing them up into classifications. The results are as follows: |

|
| |
| Table 2 shows the results from applying the Parabolic trading system. The failure of this trading system is glaring as only one category of REITs is profitable. A second drawback to using this system to trade REITs is that over twice as many trades are involved as the RSI Oscillator system. This means that not only is the Parabolic system unsuccessful in terms of gross profitability, but you will also be charged more in transaction costs which will further reduce the net profitability. In short, the Parabolic system was a failure across all REITs types, all property types, and all but one sub-property type. |
| Parabolic Code Construction with EasyLanguage I. Function Inputs: AcclFact(NumericSimple); Variables: Pos(-1), SAR(Close), AF(.02), HighValue(High), LowValue(Low); If CurrentBar = 1 Then
Else
If Low < LowValue Then
If Pos = 1 Then Begin
End Else Begin
End; End; If Pos = 1 Then Begin
AF = AcclFact; LowValue = Low; HighValue = High; End Else Begin If HighValue > HighValue[1] AND AF < 0.2 Then
End; If SAR > Low Then
If SAR > Low[1] Then
End Else Begin
AF = AcclFact; LowValue = Low; HighValue = High; End Else Begin
If LowValue < LowValue[1] AND AF < 0.2 Then
End; If SAR < High Then
If SAR < High[1] Then
End; Parabolic = SAR; II. Indicator Inputs: AF(.02); value1 = Parabolic(AF); If CurrentBar > 1 Then
Else
{Parabolic Alert Criteria} If Close Crosses Over Plot1 Then
Else
III. Long Exit Signal Inputs: Acceleration(.02), FirstBarMultp(1.5); Variables: AF(0), StopPrice(0), MP(0), HighValue(0); MP = MarketPosition; If High > HighValue Then
If MP = 1 Then Begin
AF = Acceleration; HighValue = High; End Else Begin
If HighValue > HighValue[1] AND AF < 0.2 Then
End; If StopPrice > Low Then
End; If MP = 1 Then
IV. Short Exit Signal Inputs: Acceleration(.02), FirstBarMult(3); Variables: SAR(0), AF(0), StopPrice(0), MP(0), LowValue(0); MP = MarketPosition; If Low < LowValue Then
If MP = -1 Then Begin
AF = Acceleration; LowValue = Low; End Else Begin
If LowValue < LowValue[1] AND AF < 0.2 Then
End; If StopPrice < High Then
End; IF MP = -1 Then
|
| Part I - The RSI Oscillator Part III - MACD |
| Title: | Professor of Finance |
| Company: | Hawaii Pacific University |
| Address: | 1132 Bishop Street; Suite 504 |
| Honolulu, HI 96813 | |
| Phone # for sales: | 808-544-0827 |
| Fax: | 808-544-0835 |
| E-mail address: | mseiler@hpu.edu |
Traders' Resource Links | |
| Hawaii Pacific University has not added any product or service information to TRADERS' RESOURCE. | |
Click here for more information about our publications!
Comments

Request Information From Our Sponsors
- StockCharts.com, Inc.
- Candle Patterns
- Candlestick Charting Explained
- Intermarket Technical Analysis
- John Murphy on Chart Analysis
- John Murphy's Chart Pattern Recognition
- John Murphy's Market Message
- MurphyExplainsMarketAnalysis-Intermarket Analysis
- MurphyExplainsMarketAnalysis-Visual Analysis
- StockCharts.com
- Technical Analysis of the Financial Markets
- The Visual Investor
- VectorVest, Inc.
- Executive Premier Workshop
- One-Day Options Course
- OptionsPro
- Retirement Income Workshop
- Sure-Fire Trading Systems (VectorVest, Inc.)
- Trading as a Business Workshop
- VectorVest 7 EOD
- VectorVest 7 RealTime/IntraDay
- VectorVest AutoTester
- VectorVest Educational Services
- VectorVest OnLine
- VectorVest Options Analyzer
- VectorVest ProGraphics v6.0
- VectorVest ProTrader 7
- VectorVest RealTime Derby Tool
- VectorVest Simulator
- VectorVest Variator
- VectorVest Watchdog
