HOT TOPICS LIST
- MACD
- Fibonacci
- RSI
- Gann
- ADXR
- Stochastics
- Volume
- Triangles
- Futures
- Cycles
- Volatility
- ZIGZAG
- MESA
- Retracement
- Aroon
INDICATORS LIST
LIST OF TOPICS
PRINT THIS ARTICLE
by Paolo Pezzutti
The Bollinger Bands suggest a trading range is developing.
Position: N/A
Paolo Pezzutti
Author of the book "Trading the US Markets - A Comprehensive Guide to US Markets for International Traders and Investors" - Harriman House (July 2008)
PRINT THIS ARTICLE
BOLLINGER BANDS
NYMEX Crude Oil Continuous Contract: Down To Support
04/20/05 07:58:39 AMby Paolo Pezzutti
The Bollinger Bands suggest a trading range is developing.
Position: N/A
| The Bollinger Bands indicator calculates a simple arithmetic average of prices. This indicator also calculates the standard deviation. An upper band is plotted a specified number of standard deviations above this average and a lower band is plotted a specified number of standard deviations below the average. The average is not plotted. Bollinger Bands combine the trend analysis information of a moving average with the market's volatility; the distance between bands is a reflection of volatility. The bands during sideways periods act containing prices, while at the beginning of trends, Bollinger Bands tend to open with volatility expansion. Bands are a useful tool to analyze current market conditions. Combining Bollinger Bands with candlestick and momentum-based indicators, like moving average convergence/divergence (MACD), provides additional insight to market behavior. This way, you can reinforce indications coming from the bands about trend or trading range conditions and, from there, build some assessment of future price movement. It is difficult to quantify the effectiveness of this indicator as a predictor of returns or in which mode (contratrend or trend-following) it is more efficient. However, it visually aids to understand where the market stands today in terms of volatility and directionality. The MACD, on the other hand, tracks the interaction between two moving averages over time. There are several ways this indicator can be used. In this article, I refer to it in order to assess the force of market players (bulls and bears) as far as the price action is concerned. |
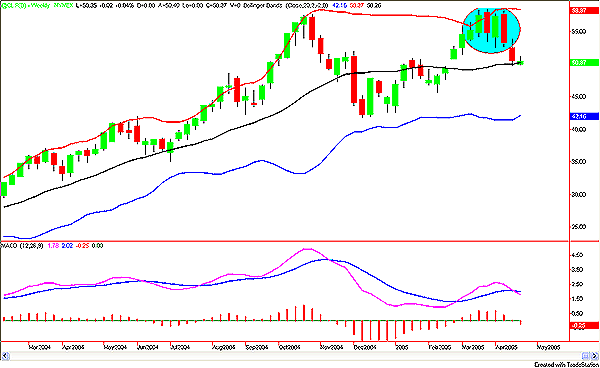
| In Figure 1, you can see the crude oil futures weekly chart. My preferred time frame is the medium-term trend. Based on what you see on this time frame, you can plan your setup on the daily/one-hour time frames accordingly. During the past year, oil moved along a stable and strong uptrend that brought prices from $30 in February 2004 to the last October high at $57.63. Until last October, prices moved above their moving average with small corrections and pullbacks -- the ideal environment for a trend-follower! In October, there was an increase in volatility that brought prices to their highs, which then led to a correction with its low at $41.78 in December 2004. This correction was the ringing bell that something was changing in the market. In fact, the week of December 3 printed a wide range bar (the widest of the whole year!), indicating that the uptrend for the moment was over. Prices, however, found an important support at the $42 area and moved back up again -- no surprise. It often happens that, when the trend is strong, after squeezing the weak "hands," it resumes its way up to test at least the previous high. Prices moved to test the resistance level in March 2005, moving with lower volatility and momentum than in the previous phase of the uptrend. The MACD showed a significant divergence, and the congestion at the top resulted in a reversal with price moving down toward the moving average in the middle of the bands. Alternating bars ended with a wide range engulfing bar, with MACD giving a sell signal (the week of April 8). |

|
| Figure 1: Nymex Crude Oil Continuous Contract, Weekly |
| Graphic provided by: TradeStation. |
| |
| In summary: - In the long term, oil is still in a uptrend. - In the medium term (weekly), Bollinger Bands are flat and indicate the current trading range phase, with resistance at $57 and support at $42. - In the short term, indications are for lower prices. It is early to say how this consolidation will evolve. Many scenarios are open -- for example, a bullish triangle, a double top, and so forth. Your trading strategy on the daily/hourly time frames, however, must take into account the macrophase of the market to select the most effective tools and patterns to operate given the current market conditions. |
Author of the book "Trading the US Markets - A Comprehensive Guide to US Markets for International Traders and Investors" - Harriman House (July 2008)
| Address: | VIA ROBERTO AGO 26 POSTAL CODE 00166 |
| Rome, ITALY | |
| Phone # for sales: | +393357540708 |
| E-mail address: | pezzutti.paolo@tiscali.it |
Click here for more information about our publications!
Comments
Date: 04/20/05Rank: 4Comment:
Date: 04/20/05Rank: 4Comment:

|

Request Information From Our Sponsors
- VectorVest, Inc.
- Executive Premier Workshop
- One-Day Options Course
- OptionsPro
- Retirement Income Workshop
- Sure-Fire Trading Systems (VectorVest, Inc.)
- Trading as a Business Workshop
- VectorVest 7 EOD
- VectorVest 7 RealTime/IntraDay
- VectorVest AutoTester
- VectorVest Educational Services
- VectorVest OnLine
- VectorVest Options Analyzer
- VectorVest ProGraphics v6.0
- VectorVest ProTrader 7
- VectorVest RealTime Derby Tool
- VectorVest Simulator
- VectorVest Variator
- VectorVest Watchdog
- StockCharts.com, Inc.
- Candle Patterns
- Candlestick Charting Explained
- Intermarket Technical Analysis
- John Murphy on Chart Analysis
- John Murphy's Chart Pattern Recognition
- John Murphy's Market Message
- MurphyExplainsMarketAnalysis-Intermarket Analysis
- MurphyExplainsMarketAnalysis-Visual Analysis
- StockCharts.com
- Technical Analysis of the Financial Markets
- The Visual Investor
