HOT TOPICS LIST
- MACD
- Fibonacci
- RSI
- Gann
- ADXR
- Stochastics
- Volume
- Triangles
- Futures
- Cycles
- Volatility
- ZIGZAG
- MESA
- Retracement
- Aroon
INDICATORS LIST
LIST OF TOPICS
PRINT THIS ARTICLE
by Arthur Hill
Microsoft has been range bound for over two years and the subsequent break is likely to fuel the next move in the Nasdaq.
Position: Hold
Arthur Hill
Arthur Hill is currently editor of TDTrader.com, a website specializing in trading strategies, sector/industry specific breadth stats and overall technical analysis. He passed the Society of Technical Analysts (STA London) diploma exam with distinction is a Certified Financial Technician (CFTe). Prior to TD Trader, he was the Chief Technical Analyst for Stockcharts.com and the main contributor to the ChartSchool.
PRINT THIS ARTICLE
RECURRENT PATTERNS
Microsoft Caught In A Trap
09/16/04 01:35:47 PMby Arthur Hill
Microsoft has been range bound for over two years and the subsequent break is likely to fuel the next move in the Nasdaq.
Position: Hold
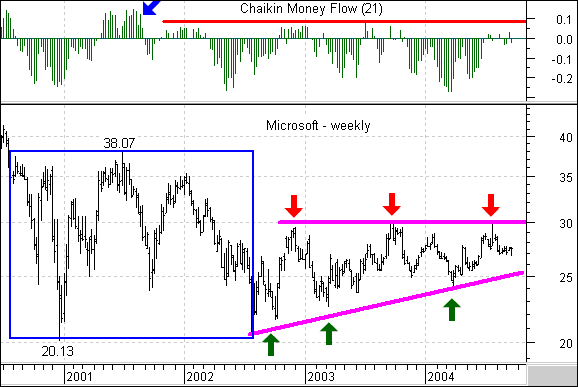
| Microsoft (MSFT) moved from a wide range in 2000 to 2002 to a relatively tight range in the following two years, 2002 to 2004. From April 2000 to July 2002 (blue box), the stock traded in an 18 point range (20.13 to 38.07). There were some pretty good swings in this range, but the current range (10 points) has tightened without much opportunity for trading. |

|
| Figure 1: Weekly chart of MSFT. |
| Graphic provided by: MetaStock. |
| |
| The pattern at work looks like an ascending triangle. These are usually bullish continuation patterns, but can also form as a base. The higher lows (green arrows) shows demand (support) at higher levels and the equal highs show overhead supply (resistance). Even though the higher lows are positive, they are of little consequence unless buyers can muster the strength to punch through a multi-year resistance barrier. A move above 30 would confirm this pattern as bullish and project further strength to the upper 30s. |
| A look at the 21-week Chaikin money flow confirms overhead resistance. This price and volume based indicator measures buying and selling pressure each week. Notice how the indicator has been unable to move above .10 (+10%) over the last three years. August 2001 was the last time the Chaikin money flow was above +10% (blue arrow). A move above +10% could be used to confirm a breakout at 30 in the stock. |
| As long as the Chaikin money flow remains below +10% and the stock below 30, the outlook is neutral at best. A move below 25 would break the lower trendline of the ascending triangle and argue for at least another test of support around 20. |
Arthur Hill is currently editor of TDTrader.com, a website specializing in trading strategies, sector/industry specific breadth stats and overall technical analysis. He passed the Society of Technical Analysts (STA London) diploma exam with distinction is a Certified Financial Technician (CFTe). Prior to TD Trader, he was the Chief Technical Analyst for Stockcharts.com and the main contributor to the ChartSchool.
| Title: | Editor |
| Company: | TDTrader.com |
| Address: | Willem Geetsstraat 17 |
| Mechelen, B2800 | |
| Phone # for sales: | 3215345465 |
| Website: | www.tdtrader.com |
| E-mail address: | arthurh@tdtrader.com |
Traders' Resource Links | |
| TDTrader.com has not added any product or service information to TRADERS' RESOURCE. | |
Click here for more information about our publications!
Comments
Date: 09/16/04Rank: 4Comment:

|

Request Information From Our Sponsors
- StockCharts.com, Inc.
- Candle Patterns
- Candlestick Charting Explained
- Intermarket Technical Analysis
- John Murphy on Chart Analysis
- John Murphy's Chart Pattern Recognition
- John Murphy's Market Message
- MurphyExplainsMarketAnalysis-Intermarket Analysis
- MurphyExplainsMarketAnalysis-Visual Analysis
- StockCharts.com
- Technical Analysis of the Financial Markets
- The Visual Investor
- VectorVest, Inc.
- Executive Premier Workshop
- One-Day Options Course
- OptionsPro
- Retirement Income Workshop
- Sure-Fire Trading Systems (VectorVest, Inc.)
- Trading as a Business Workshop
- VectorVest 7 EOD
- VectorVest 7 RealTime/IntraDay
- VectorVest AutoTester
- VectorVest Educational Services
- VectorVest OnLine
- VectorVest Options Analyzer
- VectorVest ProGraphics v6.0
- VectorVest ProTrader 7
- VectorVest RealTime Derby Tool
- VectorVest Simulator
- VectorVest Variator
- VectorVest Watchdog
