HOT TOPICS LIST
- MACD
- Fibonacci
- RSI
- Gann
- ADXR
- Stochastics
- Volume
- Triangles
- Futures
- Cycles
- Volatility
- ZIGZAG
- MESA
- Retracement
- Aroon
INDICATORS LIST
LIST OF TOPICS
PRINT THIS ARTICLE
by Arthur Hill
After a big move in August, Schwab finds itself with a nice reversal pattern in search of volume for confirmation.
Position: Hold
Arthur Hill
Arthur Hill is currently editor of TDTrader.com, a website specializing in trading strategies, sector/industry specific breadth stats and overall technical analysis. He passed the Society of Technical Analysts (STA London) diploma exam with distinction is a Certified Financial Technician (CFTe). Prior to TD Trader, he was the Chief Technical Analyst for Stockcharts.com and the main contributor to the ChartSchool.
PRINT THIS ARTICLE
CHART ANALYSIS
Schwab Looking For Volume
09/16/04 01:33:17 PMby Arthur Hill
After a big move in August, Schwab finds itself with a nice reversal pattern in search of volume for confirmation.
Position: Hold
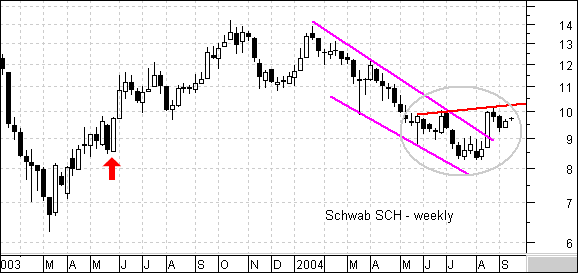
| Starting with the weekly chart for some perspective, we can see that Schwab (SCH) declined more like a high-priced tech stock than a broker. While the S&P 500 has traded in a relatively flat pattern for the last eight to nine months, Schwab was knocked all the way back to its May 2003 lows (red arrow). |

|
| Figure 1: Weekly chart of Schwab. |
| Graphic provided by: MetaStock. |
| |
| The decline looks like a falling wedge and the stock managed to stabilize above 8 this summer. The long white candlestick in August broke above the upper trendline, but we have yet to see follow through to this late summer pop. |
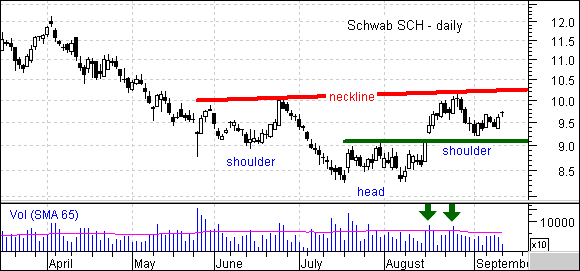
 Figure 2: Daily chart of Schwab. Turning to the daily chart, the pattern from June to September looks like an inverse head and shoulders. The left shoulder formed in June, the head in July/August and the right shoulder is currently under construction. Also notice that broken resistance just above 9 turned into support for the left shoulder (green line). |
| This head and shoulders pattern and volume hold the key. The July decline occurred on high volume and the stock then consolidated on low volume to form the head. The August advance featured two days of above average volume (green arrows), but nothing near the levels seen in July. For this pattern to be considered robust, volume needs to expand on any move towards the neckline and/or on any neckline breakout. A neckline breakout on above average volume would be bullish for both the weekly and daily chart with the first target around 12. |
Arthur Hill is currently editor of TDTrader.com, a website specializing in trading strategies, sector/industry specific breadth stats and overall technical analysis. He passed the Society of Technical Analysts (STA London) diploma exam with distinction is a Certified Financial Technician (CFTe). Prior to TD Trader, he was the Chief Technical Analyst for Stockcharts.com and the main contributor to the ChartSchool.
| Title: | Editor |
| Company: | TDTrader.com |
| Address: | Willem Geetsstraat 17 |
| Mechelen, B2800 | |
| Phone # for sales: | 3215345465 |
| Website: | www.tdtrader.com |
| E-mail address: | arthurh@tdtrader.com |
Traders' Resource Links | |
| TDTrader.com has not added any product or service information to TRADERS' RESOURCE. | |
Click here for more information about our publications!
Comments
Date: 09/16/04Rank: 4Comment:

|

Request Information From Our Sponsors
- StockCharts.com, Inc.
- Candle Patterns
- Candlestick Charting Explained
- Intermarket Technical Analysis
- John Murphy on Chart Analysis
- John Murphy's Chart Pattern Recognition
- John Murphy's Market Message
- MurphyExplainsMarketAnalysis-Intermarket Analysis
- MurphyExplainsMarketAnalysis-Visual Analysis
- StockCharts.com
- Technical Analysis of the Financial Markets
- The Visual Investor
- VectorVest, Inc.
- Executive Premier Workshop
- One-Day Options Course
- OptionsPro
- Retirement Income Workshop
- Sure-Fire Trading Systems (VectorVest, Inc.)
- Trading as a Business Workshop
- VectorVest 7 EOD
- VectorVest 7 RealTime/IntraDay
- VectorVest AutoTester
- VectorVest Educational Services
- VectorVest OnLine
- VectorVest Options Analyzer
- VectorVest ProGraphics v6.0
- VectorVest ProTrader 7
- VectorVest RealTime Derby Tool
- VectorVest Simulator
- VectorVest Variator
- VectorVest Watchdog
