HOT TOPICS LIST
- MACD
- Fibonacci
- RSI
- Gann
- ADXR
- Stochastics
- Volume
- Triangles
- Futures
- Cycles
- Volatility
- ZIGZAG
- MESA
- Retracement
- Aroon
INDICATORS LIST
LIST OF TOPICS
PRINT THIS ARTICLE
by Andrew Hetherington
A quick look at the charts for Alcoa Inc.
Position: N/A
Andrew Hetherington
Classic Dow Theorist who trades as a pure technician, using pattern recognition.
PRINT THIS ARTICLE
BREAKOUTS
Alcoa Incorporated (AA) Is Breaking Out.
09/08/04 03:21:42 PMby Andrew Hetherington
A quick look at the charts for Alcoa Inc.
Position: N/A
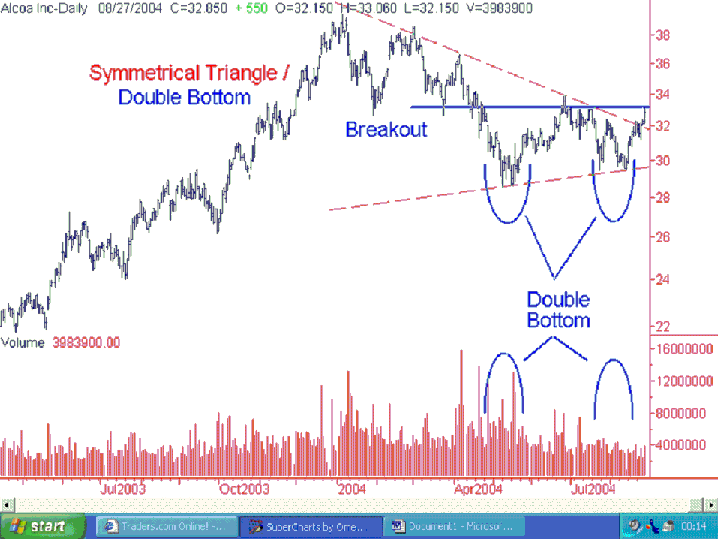
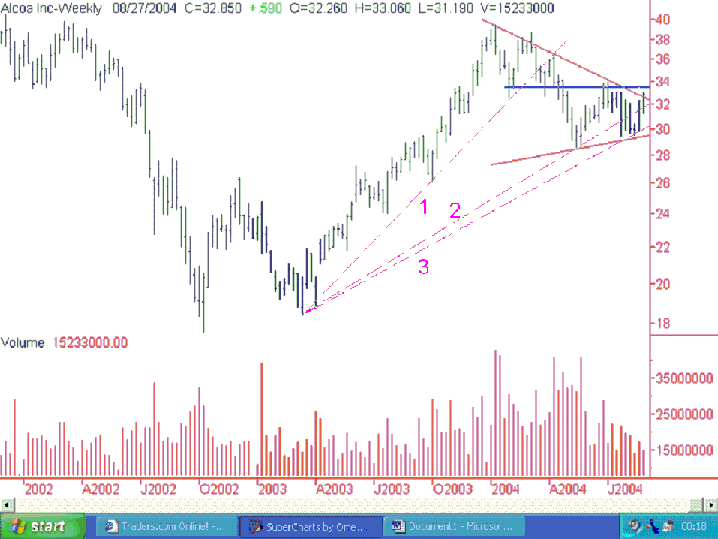
| On the weekly chart we see the perfectly diminished volume on this double bottom. I prefer the double bottom to the symmetrical triangle, but both are correct. There is much higher volume on the first bottom in May compared to the much lower cumulative volume on the second bottom in August. The breakout is in the $33.20 area, give or take a little. Ideally, we'd like to see a pick up in cumulative activity on this rise up otherwise this double bottom will be considered unreliable. My thoughts are that it will continue to move higher in spite of the general trend being temporarily short. I say temporarily since I don't expect this shorting period to last very long. We are currently trending sideways or downwards and sideways markets are very troublesome to traders. This won't last too long since it is a Presidential election year and the summer slumber is over. |
 Figure 1: Daily chart for Alcoa. The third fan line was created in the $30.00 area and I expect this line to hold. When my performance line is broken it will be time to sell out your long position. |

|
| Figure 2: Weekly chart for Alcoa. |
| Graphic provided by: SuperCharts. |
| |
Classic Dow Theorist who trades as a pure technician, using pattern recognition.
| Toronto, Canada |
Click here for more information about our publications!
Comments
Date: 09/09/04Rank: 3Comment:

Request Information From Our Sponsors
- VectorVest, Inc.
- Executive Premier Workshop
- One-Day Options Course
- OptionsPro
- Retirement Income Workshop
- Sure-Fire Trading Systems (VectorVest, Inc.)
- Trading as a Business Workshop
- VectorVest 7 EOD
- VectorVest 7 RealTime/IntraDay
- VectorVest AutoTester
- VectorVest Educational Services
- VectorVest OnLine
- VectorVest Options Analyzer
- VectorVest ProGraphics v6.0
- VectorVest ProTrader 7
- VectorVest RealTime Derby Tool
- VectorVest Simulator
- VectorVest Variator
- VectorVest Watchdog
- StockCharts.com, Inc.
- Candle Patterns
- Candlestick Charting Explained
- Intermarket Technical Analysis
- John Murphy on Chart Analysis
- John Murphy's Chart Pattern Recognition
- John Murphy's Market Message
- MurphyExplainsMarketAnalysis-Intermarket Analysis
- MurphyExplainsMarketAnalysis-Visual Analysis
- StockCharts.com
- Technical Analysis of the Financial Markets
- The Visual Investor
