HOT TOPICS LIST
- MACD
- Fibonacci
- RSI
- Gann
- ADXR
- Stochastics
- Volume
- Triangles
- Futures
- Cycles
- Volatility
- ZIGZAG
- MESA
- Retracement
- Aroon
INDICATORS LIST
LIST OF TOPICS
PRINT THIS ARTICLE
by Andrew Hetherington
Here's an example of a perfect symmetrical triangle chart formation.
Position: N/A
Andrew Hetherington
Classic Dow Theorist who trades as a pure technician, using pattern recognition.
PRINT THIS ARTICLE
SYMMETRICAL TRIANGLE
McDonalds Corporation Has Broken Its Trend.
09/08/04 03:25:13 PMby Andrew Hetherington
Here's an example of a perfect symmetrical triangle chart formation.
Position: N/A
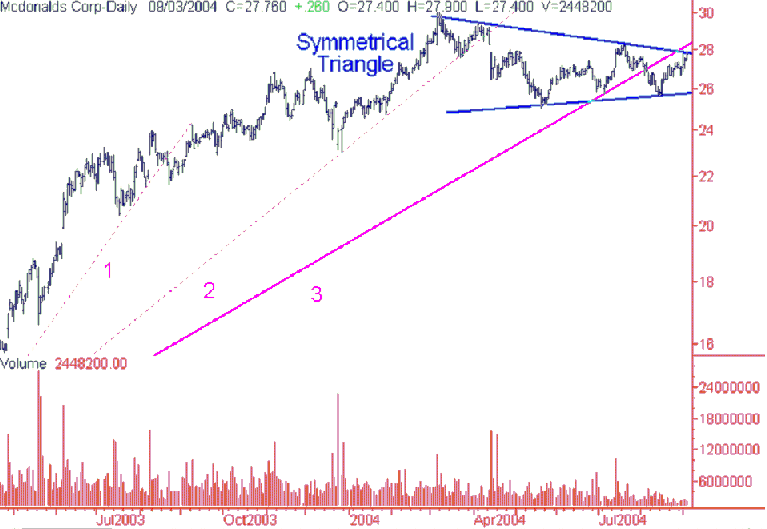
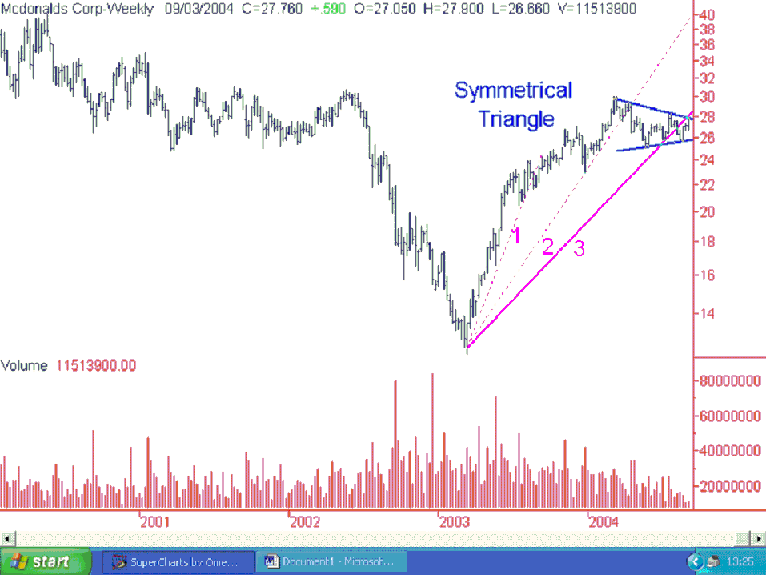
| McDonalds (MCD) has formed an 8-month symmetrical triangle with perfectly diminished volume on the creation of the pattern. This pattern is as perfect as you can find. In addition, this equity has also broken its short-term trend from up to down. The third fan line was broken in early August and is currently on the pullback up towards the line in the $28.00 area. This pullback is accompanied with light volume, which gives every indication of the inevitable drop to come. Naturally, this pattern has not completed quite yet, so a word of caution is necessary. These triangles can go either way. Given the general market trend and the breaking of the third fan line I suspect it will cooperate. |
 Figure 1: Daily chart for MCD. My suggestion on how best to trade this equity profitably is to play the September or October $30.00 puts. These have little premium built in and if this equity drops as I suspect then it will be quite profitable. Trading this pattern off of the top line of the triangle is a fairly safe trade since the downside is so limited. If I'm incorrect with my prognostication and it breaks topside of the $28.00 line with high volume, then you sell your puts with a minimal loss. If this equity drops lower but does not breakout on the downside below the $25.75 line then you still make a handsome profit. If it breaks below $25.75, then you sell your puts on the day it breaks with high volume at a large profit. This is "pot odds" once again: The potential grand slam home run for minimal risk. |

|
| Figure 2: Weekly chart for MCD. |
| Graphic provided by: SuperCharts. |
| |
Classic Dow Theorist who trades as a pure technician, using pattern recognition.
| Toronto, Canada |
Click here for more information about our publications!
Comments
Date: 09/09/04Rank: 3Comment:

Request Information From Our Sponsors
- StockCharts.com, Inc.
- Candle Patterns
- Candlestick Charting Explained
- Intermarket Technical Analysis
- John Murphy on Chart Analysis
- John Murphy's Chart Pattern Recognition
- John Murphy's Market Message
- MurphyExplainsMarketAnalysis-Intermarket Analysis
- MurphyExplainsMarketAnalysis-Visual Analysis
- StockCharts.com
- Technical Analysis of the Financial Markets
- The Visual Investor
- VectorVest, Inc.
- Executive Premier Workshop
- One-Day Options Course
- OptionsPro
- Retirement Income Workshop
- Sure-Fire Trading Systems (VectorVest, Inc.)
- Trading as a Business Workshop
- VectorVest 7 EOD
- VectorVest 7 RealTime/IntraDay
- VectorVest AutoTester
- VectorVest Educational Services
- VectorVest OnLine
- VectorVest Options Analyzer
- VectorVest ProGraphics v6.0
- VectorVest ProTrader 7
- VectorVest RealTime Derby Tool
- VectorVest Simulator
- VectorVest Variator
- VectorVest Watchdog
