HOT TOPICS LIST
- MACD
- Fibonacci
- RSI
- Gann
- ADXR
- Stochastics
- Volume
- Triangles
- Futures
- Cycles
- Volatility
- ZIGZAG
- MESA
- Retracement
- Aroon
INDICATORS LIST
LIST OF TOPICS
PRINT THIS ARTICLE
by Andrew Hetherington
A large ascending triangle on the chart of SBC Communications could offer profitable trading opportunities.
Position: N/A
Andrew Hetherington
Classic Dow Theorist who trades as a pure technician, using pattern recognition.
PRINT THIS ARTICLE
ASCENDING TRIANGLES
SBC Communications Is Making A Bullish Pattern
09/08/04 03:29:54 PMby Andrew Hetherington
A large ascending triangle on the chart of SBC Communications could offer profitable trading opportunities.
Position: N/A
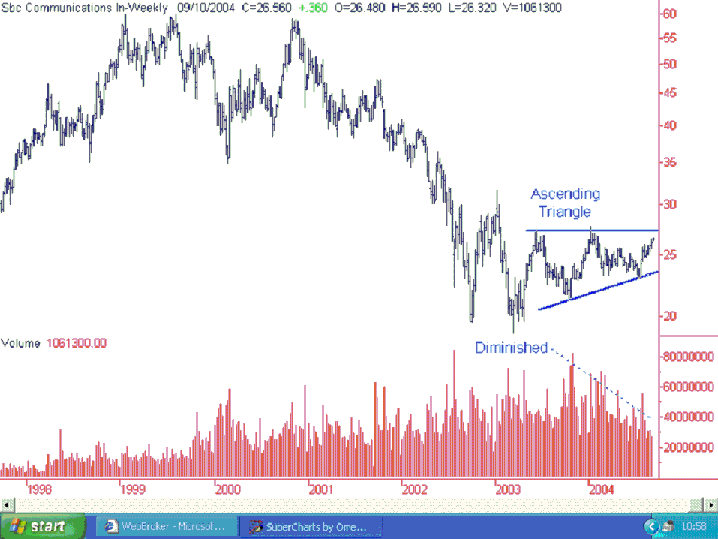
| SBC Communications is currently making an ascending triangle, which is 14 months in duration. This large triangle has perfect volume on the creation of the pattern. In addition, there is a tendency for this pattern to be bullish, or is it? This equity has been basing for some period of time and most observers would suggest that its next move should be higher since it has been basing for so long. However, I'm suggesting trading it short off of the top supply line in the $27.00 area. The idea is to catch some of the selling supply pressure when it nears the top. It will inevitably drop somewhat since the volume on this ride upwards is low. If this equity was intending on breaking out topside I would prefer to see an increase in activity off of the last bottom. Since this happened only marginally, it's a temporary short off of the top line, keeping in mind the general market conditions being temporarily short. |
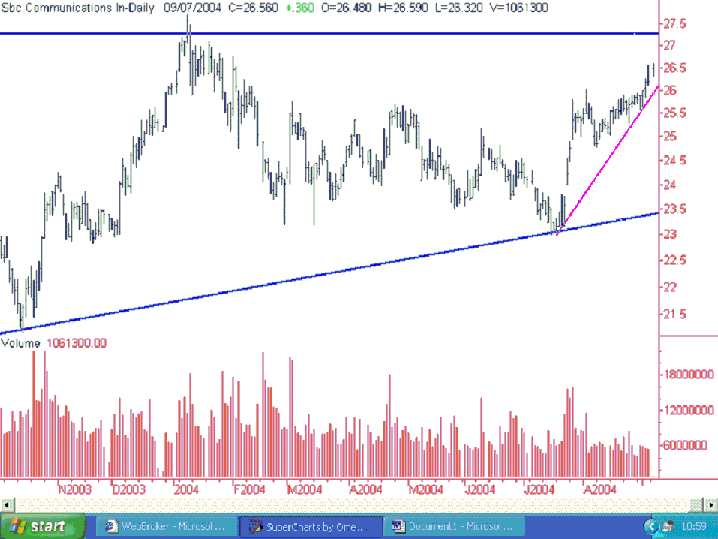
 Figure 1: Weekly chart for SBC Communications. This strategy will be effective in the very near term for trading options. After it backs off of the top line you sell your puts at a small profit but it happens in only a few days normally, so you play the "in the money" options with the most recent expiration date. Secondly, when it drops toward the magenta trend line in the $26.00 area but it doesn't break hard you sell on this line. |

|
| Figure 2: Daily chart for SBC Communications. |
| Graphic provided by: SuperCharts. |
| |
| Alternatively, you make this same trade in reverse off of the bottom trend line when the market is anticipated to move higher. |
Classic Dow Theorist who trades as a pure technician, using pattern recognition.
| Toronto, Canada |
Click here for more information about our publications!
Comments
Date: 09/09/04Rank: 2Comment:
Date: 09/14/04Rank: 4Comment:

Request Information From Our Sponsors
- StockCharts.com, Inc.
- Candle Patterns
- Candlestick Charting Explained
- Intermarket Technical Analysis
- John Murphy on Chart Analysis
- John Murphy's Chart Pattern Recognition
- John Murphy's Market Message
- MurphyExplainsMarketAnalysis-Intermarket Analysis
- MurphyExplainsMarketAnalysis-Visual Analysis
- StockCharts.com
- Technical Analysis of the Financial Markets
- The Visual Investor
- VectorVest, Inc.
- Executive Premier Workshop
- One-Day Options Course
- OptionsPro
- Retirement Income Workshop
- Sure-Fire Trading Systems (VectorVest, Inc.)
- Trading as a Business Workshop
- VectorVest 7 EOD
- VectorVest 7 RealTime/IntraDay
- VectorVest AutoTester
- VectorVest Educational Services
- VectorVest OnLine
- VectorVest Options Analyzer
- VectorVest ProGraphics v6.0
- VectorVest ProTrader 7
- VectorVest RealTime Derby Tool
- VectorVest Simulator
- VectorVest Variator
- VectorVest Watchdog
