HOT TOPICS LIST
- MACD
- Fibonacci
- RSI
- Gann
- ADXR
- Stochastics
- Volume
- Triangles
- Futures
- Cycles
- Volatility
- ZIGZAG
- MESA
- Retracement
- Aroon
INDICATORS LIST
LIST OF TOPICS
PRINT THIS ARTICLE
by Andrew Hetherington
Large and powerful formations are not always invulnerable to outside forces, and Coca-Cola is a case in point.
Position: N/A
Andrew Hetherington
Classic Dow Theorist who trades as a pure technician, using pattern recognition.
PRINT THIS ARTICLE
TRIANGLES
What's Happened To Coke?
08/30/04 10:28:55 AMby Andrew Hetherington
Large and powerful formations are not always invulnerable to outside forces, and Coca-Cola is a case in point.
Position: N/A
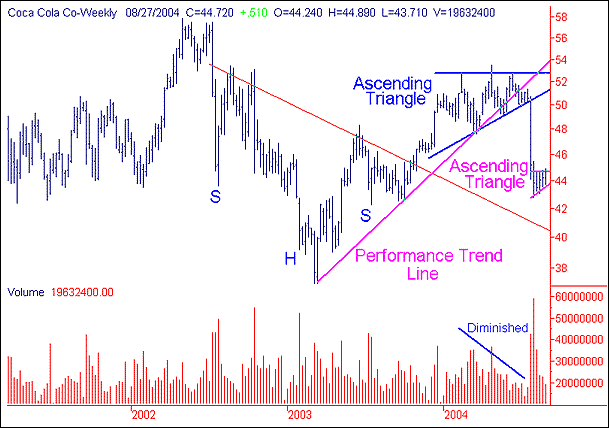
| A year ago in October 2003, Coca-Cola (KO) had broken topside of a large head and shoulders pattern in the $44.00 area. This pattern was large and powerful and there were big expectations associated with it. Coca-Cola's ride went as high as $53.00 and lasted until February 2004. This would have been a decent return of 20% in five months, which would satisfy most investors, but it seemed like a minimum of $60.00 or higher was a certainty. This is an example of why you must always keep an eye on the general trend. The general trend was in trouble and was ready to drag down even very strong equities in powerful patterns. |

|
| Figure 1: Weekly chart of Coca-Cola |
| Graphic provided by: SuperCharts. |
| |
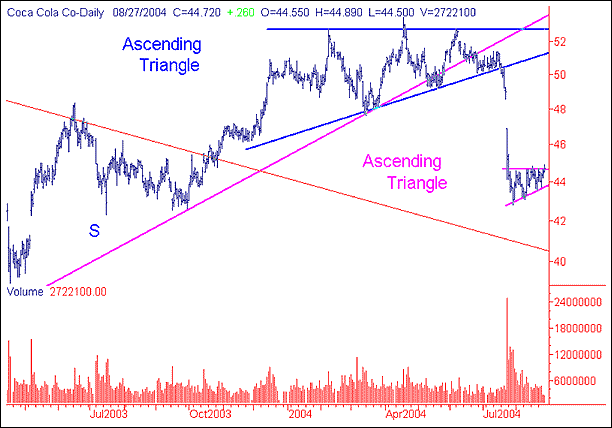
| My performance line was broken in the $51.00 area in June 2004, and when this happened ID (impending doom) was upon us. This was the warning to sell out all long positions from the large head and shoulders pattern. A 7-month ascending triangle had formed with perfectly diminished volume and was almost complete when the performance line was breached. This triangle breaks on the downside with a hard drop from $51.00 to $43.00. |
 Figure 2: Daily chart of Coca-Cola. Currently, a small 1-month ascending triangle has formed with excellent volume on the creation of the pattern. There is a tendency for these patterns to be bullish but you can see what happened to the last ascending triangle on this equity. It is overdue for a pullback and to fill in the gap, and these clues are helpful in determining the future short-term direction of this equity. If volume increases cumulatively and we see a day or two of 6-8 million shares with prices rising above the current high of $44.89, then a pullback upwards will be the direction. Given the general trend, it will be important to keep an eye on any false moves. These are moves higher with low volume. My best prognostication is for a small pullback but beware, when this gap is filled the next move will be down once again. |
Classic Dow Theorist who trades as a pure technician, using pattern recognition.
| Toronto, Canada |
Click here for more information about our publications!
Comments
Date: 09/01/04Rank: 4Comment:

Request Information From Our Sponsors
- StockCharts.com, Inc.
- Candle Patterns
- Candlestick Charting Explained
- Intermarket Technical Analysis
- John Murphy on Chart Analysis
- John Murphy's Chart Pattern Recognition
- John Murphy's Market Message
- MurphyExplainsMarketAnalysis-Intermarket Analysis
- MurphyExplainsMarketAnalysis-Visual Analysis
- StockCharts.com
- Technical Analysis of the Financial Markets
- The Visual Investor
- VectorVest, Inc.
- Executive Premier Workshop
- One-Day Options Course
- OptionsPro
- Retirement Income Workshop
- Sure-Fire Trading Systems (VectorVest, Inc.)
- Trading as a Business Workshop
- VectorVest 7 EOD
- VectorVest 7 RealTime/IntraDay
- VectorVest AutoTester
- VectorVest Educational Services
- VectorVest OnLine
- VectorVest Options Analyzer
- VectorVest ProGraphics v6.0
- VectorVest ProTrader 7
- VectorVest RealTime Derby Tool
- VectorVest Simulator
- VectorVest Variator
- VectorVest Watchdog
