HOT TOPICS LIST
- MACD
- Fibonacci
- RSI
- Gann
- ADXR
- Stochastics
- Volume
- Triangles
- Futures
- Cycles
- Volatility
- ZIGZAG
- MESA
- Retracement
- Aroon
INDICATORS LIST
LIST OF TOPICS
PRINT THIS ARTICLE
by Andrew Hetherington
Going along with the communication sector, Nortel's chart shows bearish tendencies.
Position: N/A
Andrew Hetherington
Classic Dow Theorist who trades as a pure technician, using pattern recognition.
PRINT THIS ARTICLE
DESCENDING TRIANGLES
Nortel Networks Still In Trouble
08/31/04 09:41:09 AMby Andrew Hetherington
Going along with the communication sector, Nortel's chart shows bearish tendencies.
Position: N/A
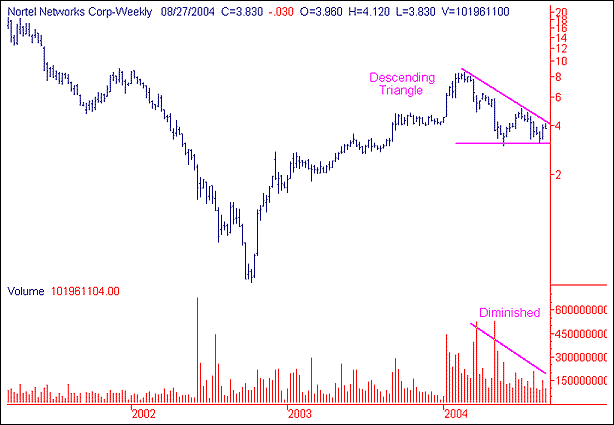
 Figure 1: Nortel Network's weekly chart. Nortel Networks (NT) has an 8-month descending triangle with perfectly diminished volume on the creation of the pattern. As is the case with Juniper, this pattern has a bearish tendency and the sectors have a tendency to move together. Although this is not an absolute, you must consider it when several equities within the same sector are showing the same patterns. There was an impressive move off of the bottom in the 43 cent area in October 2002, that moved as high as $8.50 in February of 2004. This was not unusual since most equities rallied with the general market trend throughout this period of time. Now it has consolidated and decided to push downwards, which the lack of interest on the volume side of the equation supports. |

|
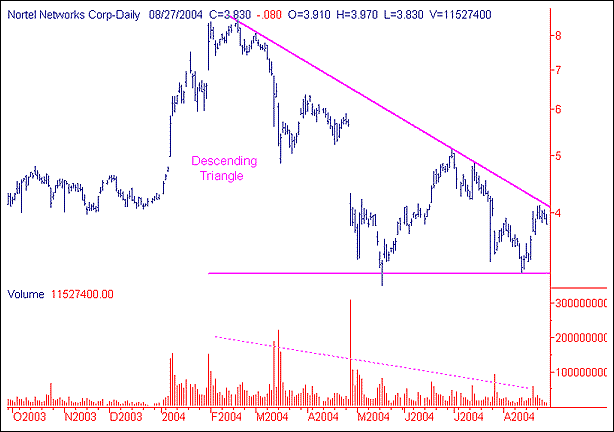
| Figure 2: Nortel Network's daily chart. |
| Graphic provided by: SuperCharts. |
| |
| The current price level of $4.00 is the prime location to short this equity. Naturally, this is trading within the pattern once again and I must emphasize that each trader should use a tight stop-loss just above the $4.00 area at $4.20. This is a 5% risk for the potential of much higher reward. Balancing the risk versus reward is a necessary part of the evaluation process. If my prognostication is correct, then this equity will drop down towards the bottom line in the $3.18 area and break this line fairly quick. |
Classic Dow Theorist who trades as a pure technician, using pattern recognition.
| Toronto, Canada |
Click here for more information about our publications!
Comments
Date: 08/31/04Rank: 5Comment:
Date: 09/01/04Rank: 5Comment:

Request Information From Our Sponsors
- StockCharts.com, Inc.
- Candle Patterns
- Candlestick Charting Explained
- Intermarket Technical Analysis
- John Murphy on Chart Analysis
- John Murphy's Chart Pattern Recognition
- John Murphy's Market Message
- MurphyExplainsMarketAnalysis-Intermarket Analysis
- MurphyExplainsMarketAnalysis-Visual Analysis
- StockCharts.com
- Technical Analysis of the Financial Markets
- The Visual Investor
- VectorVest, Inc.
- Executive Premier Workshop
- One-Day Options Course
- OptionsPro
- Retirement Income Workshop
- Sure-Fire Trading Systems (VectorVest, Inc.)
- Trading as a Business Workshop
- VectorVest 7 EOD
- VectorVest 7 RealTime/IntraDay
- VectorVest AutoTester
- VectorVest Educational Services
- VectorVest OnLine
- VectorVest Options Analyzer
- VectorVest ProGraphics v6.0
- VectorVest ProTrader 7
- VectorVest RealTime Derby Tool
- VectorVest Simulator
- VectorVest Variator
- VectorVest Watchdog
