HOT TOPICS LIST
- MACD
- Fibonacci
- RSI
- Gann
- ADXR
- Stochastics
- Volume
- Triangles
- Futures
- Cycles
- Volatility
- ZIGZAG
- MESA
- Retracement
- Aroon
INDICATORS LIST
LIST OF TOPICS
PRINT THIS ARTICLE
by Andrew Hetherington
American Express, like so many other equities at this point, is getting ready to make a move downwards.
Position: N/A
Andrew Hetherington
Classic Dow Theorist who trades as a pure technician, using pattern recognition.
PRINT THIS ARTICLE
TRIANGLES
American Express (AXP) On The Slide
08/30/04 08:37:28 AMby Andrew Hetherington
American Express, like so many other equities at this point, is getting ready to make a move downwards.
Position: N/A

|
| Graphic provided by: SuperCharts. |
| |
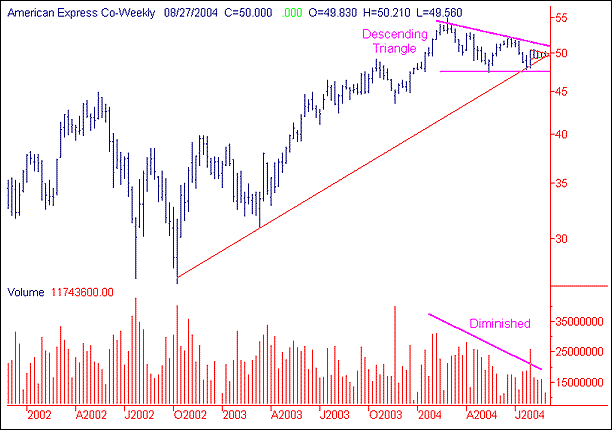
| On the weekly chart you can clearly see the perfectly diminished volume on the descending triangle. This diminished volume from the left to the right is required in triangle formations. This triangle has a bearish tendency, however this cannot be your only influence in determining which direction it will break out. You must also consider the general market direction, which is currently short. In addition, you need to examine the entire chart, carefully looking for any indication of the future direction, such as light volume rallies. The medium trend, which is two years in the making, will be the final helpful indicator of the future direction and this line is in the $49.50 area. When this line breaks on the downside it will give the assurance for those with weak hearts. |
| My suggestion is to short this equity anywhere above the $50.00 area and as close to $51.00 as possible. The first day it does not make a higher high than the previous day is the correct day to short it. I would try the January 2005 put options with a strike price of $50.00 or $47.50. If the equity moves lower towards the bottom line in the $47.50 area and doesn't break down, then sell out your options at a small profit. If it does break out lower, then sell out on the hard drop and make a good profit, as was the case with Merck. As always, trading within the pattern is a higher risk but so is the potential reward. |
Classic Dow Theorist who trades as a pure technician, using pattern recognition.
| Toronto, Canada |
Click here for more information about our publications!
Comments
Date: 09/01/04Rank: 5Comment:

|

Request Information From Our Sponsors
- StockCharts.com, Inc.
- Candle Patterns
- Candlestick Charting Explained
- Intermarket Technical Analysis
- John Murphy on Chart Analysis
- John Murphy's Chart Pattern Recognition
- John Murphy's Market Message
- MurphyExplainsMarketAnalysis-Intermarket Analysis
- MurphyExplainsMarketAnalysis-Visual Analysis
- StockCharts.com
- Technical Analysis of the Financial Markets
- The Visual Investor
- VectorVest, Inc.
- Executive Premier Workshop
- One-Day Options Course
- OptionsPro
- Retirement Income Workshop
- Sure-Fire Trading Systems (VectorVest, Inc.)
- Trading as a Business Workshop
- VectorVest 7 EOD
- VectorVest 7 RealTime/IntraDay
- VectorVest AutoTester
- VectorVest Educational Services
- VectorVest OnLine
- VectorVest Options Analyzer
- VectorVest ProGraphics v6.0
- VectorVest ProTrader 7
- VectorVest RealTime Derby Tool
- VectorVest Simulator
- VectorVest Variator
- VectorVest Watchdog
