HOT TOPICS LIST
- MACD
- Fibonacci
- RSI
- Gann
- ADXR
- Stochastics
- Volume
- Triangles
- Futures
- Cycles
- Volatility
- ZIGZAG
- MESA
- Retracement
- Aroon
INDICATORS LIST
LIST OF TOPICS
PRINT THIS ARTICLE
by Arthur Hill
Apple Computer (AAPL) has been leading the market in 2004 and just signaled another continuation higher.
Position: Buy
Arthur Hill
Arthur Hill is currently editor of TDTrader.com, a website specializing in trading strategies, sector/industry specific breadth stats and overall technical analysis. He passed the Society of Technical Analysts (STA London) diploma exam with distinction is a Certified Financial Technician (CFTe). Prior to TD Trader, he was the Chief Technical Analyst for Stockcharts.com and the main contributor to the ChartSchool.
PRINT THIS ARTICLE
TREND-CHANNEL
Apple Breaks Higher
08/26/04 12:22:07 PMby Arthur Hill
Apple Computer (AAPL) has been leading the market in 2004 and just signaled another continuation higher.
Position: Buy
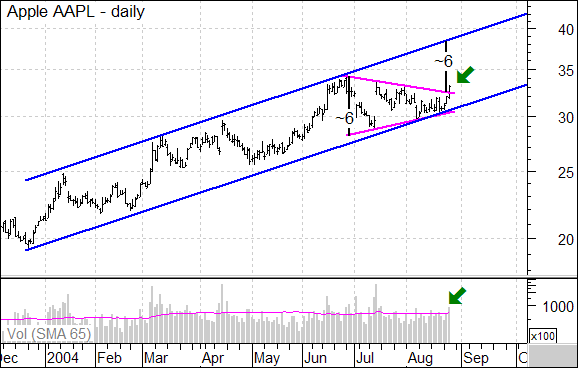
 Figure 1: Daily chart of AAPL. On the daily chart, AAPL has been working its way higher within a rising price channel since December 2003. While the Nasdaq declined sharply in July and August, Apple gapped higher in mid-July and held firm throughout Nasdaq's weakness. |
| The resulting pattern was a symmetrical triangle (magenta trendlines) and the recent breakout signals another continuation higher. Notice that volume was above average on the breakout and this further validates strength. This is especially impressive considering that overall volume levels for the Nasdaq have been below average in August. With a fresh breakout, it is time to consider upside targets and there are three options. First, the symmetrical triangle projects further strength to around 38 - 39. The width of the pattern (about 6) is added to the breakout (32.3) for a target. Second, the upper trendline of the rising price channel extends above 40 in September. Should the stock continue the prior rate of ascent, a move to the upper trendline can be expected. |

|
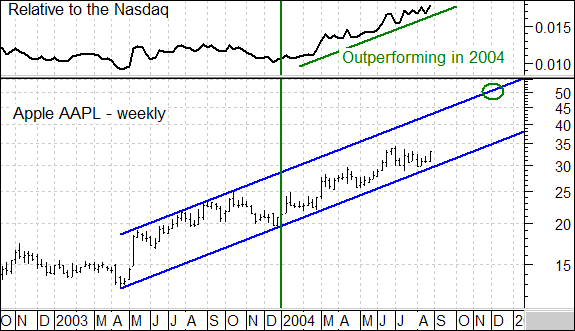
| Figure 2: Weekly chart of AAPL. |
| Graphic provided by: MetaStock. |
| |
| Turning to the weekly chart, we can see an even larger price channel and higher target further on the horizon. This price channel extends back to April 2003 and the upper trendline projects a move to around 50 by the end of November (green circle). Perhaps Christmas is coming early for the maker of the iPod. |
Arthur Hill is currently editor of TDTrader.com, a website specializing in trading strategies, sector/industry specific breadth stats and overall technical analysis. He passed the Society of Technical Analysts (STA London) diploma exam with distinction is a Certified Financial Technician (CFTe). Prior to TD Trader, he was the Chief Technical Analyst for Stockcharts.com and the main contributor to the ChartSchool.
| Title: | Editor |
| Company: | TDTrader.com |
| Address: | Willem Geetsstraat 17 |
| Mechelen, B2800 | |
| Phone # for sales: | 3215345465 |
| Website: | www.tdtrader.com |
| E-mail address: | arthurh@tdtrader.com |
Traders' Resource Links | |
| TDTrader.com has not added any product or service information to TRADERS' RESOURCE. | |
Click here for more information about our publications!
Comments
Date: 09/01/04Rank: 5Comment:

Request Information From Our Sponsors
- StockCharts.com, Inc.
- Candle Patterns
- Candlestick Charting Explained
- Intermarket Technical Analysis
- John Murphy on Chart Analysis
- John Murphy's Chart Pattern Recognition
- John Murphy's Market Message
- MurphyExplainsMarketAnalysis-Intermarket Analysis
- MurphyExplainsMarketAnalysis-Visual Analysis
- StockCharts.com
- Technical Analysis of the Financial Markets
- The Visual Investor
- VectorVest, Inc.
- Executive Premier Workshop
- One-Day Options Course
- OptionsPro
- Retirement Income Workshop
- Sure-Fire Trading Systems (VectorVest, Inc.)
- Trading as a Business Workshop
- VectorVest 7 EOD
- VectorVest 7 RealTime/IntraDay
- VectorVest AutoTester
- VectorVest Educational Services
- VectorVest OnLine
- VectorVest Options Analyzer
- VectorVest ProGraphics v6.0
- VectorVest ProTrader 7
- VectorVest RealTime Derby Tool
- VectorVest Simulator
- VectorVest Variator
- VectorVest Watchdog
