HOT TOPICS LIST
- MACD
- Fibonacci
- RSI
- Gann
- ADXR
- Stochastics
- Volume
- Triangles
- Futures
- Cycles
- Volatility
- ZIGZAG
- MESA
- Retracement
- Aroon
INDICATORS LIST
LIST OF TOPICS
PRINT THIS ARTICLE
by Andrew Hetherington
Genentech Incorporated (DNA) has been a good long trade since early 2003, going from the $16.00 area in March to a $68.00 high in March of 2004. Currently, it is in a good short position.
Position: N/A
Andrew Hetherington
Classic Dow Theorist who trades as a pure technician, using pattern recognition.
PRINT THIS ARTICLE
HEAD & SHOULDERS
What's In Store For DNA?
08/23/04 09:30:16 AMby Andrew Hetherington
Genentech Incorporated (DNA) has been a good long trade since early 2003, going from the $16.00 area in March to a $68.00 high in March of 2004. Currently, it is in a good short position.
Position: N/A
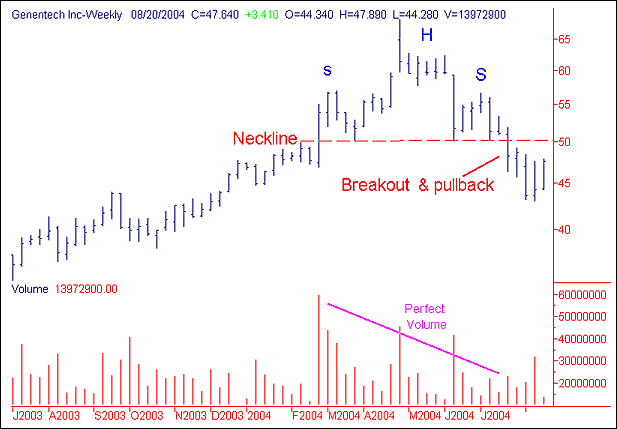
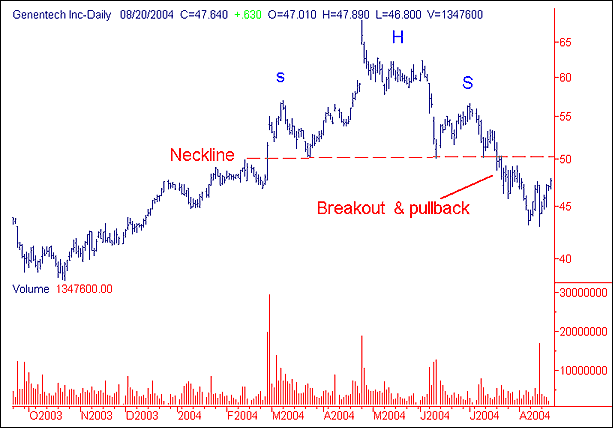
 Figure 1: Weekly chart of DNA. Looking at the daily chart below, a 6-month head and shoulders top has formed with perfect volume on the creation of the pattern. The volume diminishes slowly from the left to the right, increasing on each top that is made. The neckline is just above the $50.00 area at approximately the $50.50 area. This neckline slopes slightly upwards, which is the preference when a head and shoulders top is formed. The breakout through the neckline brought it to a low of $43.00 and it is currently on the pullback upwards toward the neckline. Taking a short position anywhere near the neckline in the $47.50 - $49.00 area should be rewarded down the road. |

|
| Figure 2: Daily chart of DNA. |
| Graphic provided by: SuperCharts. |
| |
| If this equity continues to rise after taking a short position, use the neckline as your bailout mark. The risk is minimized when you use this line as your boundary. This gives you a 3% risk for a minimum of 9% gain when it drops lower towards the first support in the $43.00 area. Poker players refer to this as "pot odds." You always take the chance when the pot odds are in your favor; it's a good money management technique. In addition, if I were sitting in a long position and did not want to sell I would take a hedge position with some put options to protect my downside risk. |
Classic Dow Theorist who trades as a pure technician, using pattern recognition.
| Toronto, Canada |
Click here for more information about our publications!
Comments
Date: 08/24/04Rank: 4Comment:

|

Request Information From Our Sponsors
- VectorVest, Inc.
- Executive Premier Workshop
- One-Day Options Course
- OptionsPro
- Retirement Income Workshop
- Sure-Fire Trading Systems (VectorVest, Inc.)
- Trading as a Business Workshop
- VectorVest 7 EOD
- VectorVest 7 RealTime/IntraDay
- VectorVest AutoTester
- VectorVest Educational Services
- VectorVest OnLine
- VectorVest Options Analyzer
- VectorVest ProGraphics v6.0
- VectorVest ProTrader 7
- VectorVest RealTime Derby Tool
- VectorVest Simulator
- VectorVest Variator
- VectorVest Watchdog
- StockCharts.com, Inc.
- Candle Patterns
- Candlestick Charting Explained
- Intermarket Technical Analysis
- John Murphy on Chart Analysis
- John Murphy's Chart Pattern Recognition
- John Murphy's Market Message
- MurphyExplainsMarketAnalysis-Intermarket Analysis
- MurphyExplainsMarketAnalysis-Visual Analysis
- StockCharts.com
- Technical Analysis of the Financial Markets
- The Visual Investor
