HOT TOPICS LIST
- MACD
- Fibonacci
- RSI
- Gann
- ADXR
- Stochastics
- Volume
- Triangles
- Futures
- Cycles
- Volatility
- ZIGZAG
- MESA
- Retracement
- Aroon
INDICATORS LIST
LIST OF TOPICS
PRINT THIS ARTICLE
by Andrew Hetherington
The long-term trend for Merck and Company has been in jeopardy since it broke through its support line in December of 2001. What is the new outlook for this company?
Position: N/A
Andrew Hetherington
Classic Dow Theorist who trades as a pure technician, using pattern recognition.
PRINT THIS ARTICLE
CHART ANALYSIS
Merck and Company (MRK). . . What's Happened?
08/20/04 01:13:24 PMby Andrew Hetherington
The long-term trend for Merck and Company has been in jeopardy since it broke through its support line in December of 2001. What is the new outlook for this company?
Position: N/A
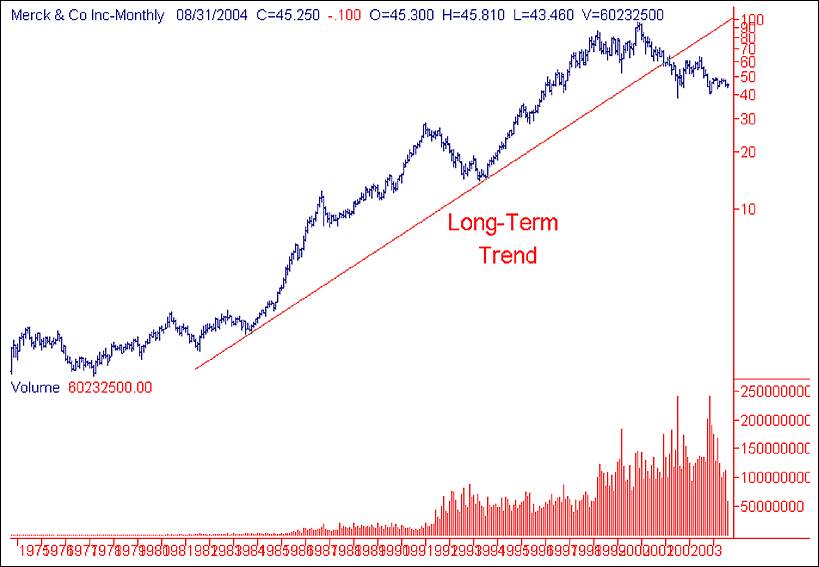
| Since 2001, when its long-term trendline broke, Merck has been in a slow but steady fall from the $96.00 area. It bottomed out on November 28, 2003 in the $41.00 area. The necessary consolidation has taken place since then and it has now formed a 9-month ascending triangle. |

|
| Figure 1: Long-term look at Merck and Company. |
| Graphic provided by: SuperCharts. |
| |
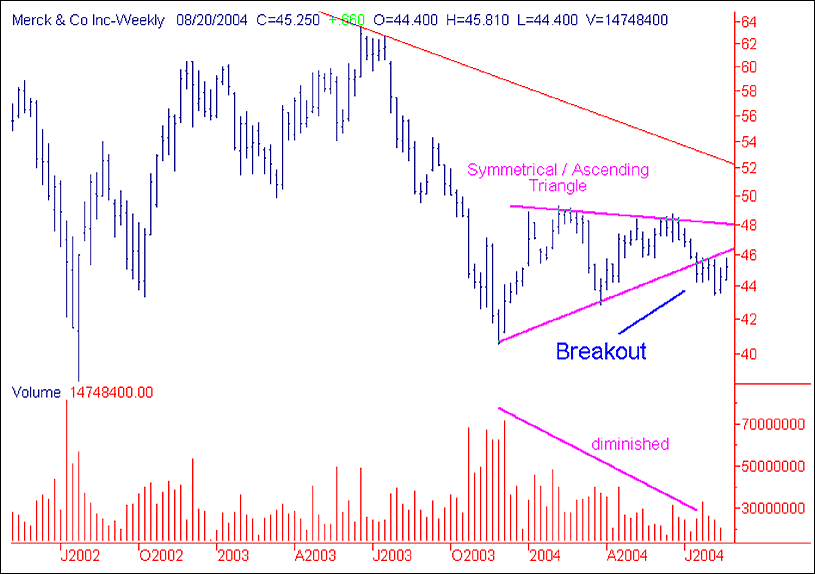
This triangle has near perfect volume on the creation of the pattern. It diminishes slowly from left to right. Although this type of triangle has a bullish tendency, it has broken to the downside. This breakout occurred at the appropriate point in the triangle -- two thirds of the way through the creation of the triangle. The general market conditions were much improved over this same period of 2004 and this equity stayed in a tight range from $42.00 - $48.00. This was another indication of the future direction.  Figure 2: Weekly chart of MRK. The inevitable pullback up towards the breakout line in the $46.00 - $47.00 has now occurred and the next move will be downwards especially when we consider that the general trend is short as well. This is not a good long prospect but a fairly safe short opportunity. |
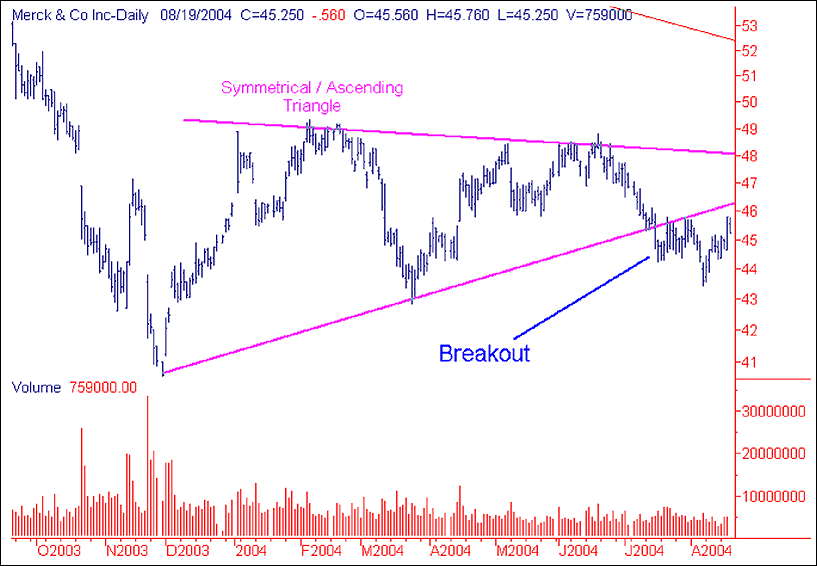
 Figure 3: Daily chart of MRK. The first stop will be in the support area of $41.00. It may hesitate here for a while but it looks like it will fulfill its destiny and move towards the next support in the $38.50 area. Although this is not a huge move, trading it short in the $46.00 area and buying it back in the $39.00 area will be a 15% return. As always, move out of your short positions on any hard and fast down days with big volumes. This is usually the temporary bottom. |
Classic Dow Theorist who trades as a pure technician, using pattern recognition.
| Toronto, Canada |
Click here for more information about our publications!
Comments
Date: 08/24/04Rank: 5Comment:

Request Information From Our Sponsors
- StockCharts.com, Inc.
- Candle Patterns
- Candlestick Charting Explained
- Intermarket Technical Analysis
- John Murphy on Chart Analysis
- John Murphy's Chart Pattern Recognition
- John Murphy's Market Message
- MurphyExplainsMarketAnalysis-Intermarket Analysis
- MurphyExplainsMarketAnalysis-Visual Analysis
- StockCharts.com
- Technical Analysis of the Financial Markets
- The Visual Investor
- VectorVest, Inc.
- Executive Premier Workshop
- One-Day Options Course
- OptionsPro
- Retirement Income Workshop
- Sure-Fire Trading Systems (VectorVest, Inc.)
- Trading as a Business Workshop
- VectorVest 7 EOD
- VectorVest 7 RealTime/IntraDay
- VectorVest AutoTester
- VectorVest Educational Services
- VectorVest OnLine
- VectorVest Options Analyzer
- VectorVest ProGraphics v6.0
- VectorVest ProTrader 7
- VectorVest RealTime Derby Tool
- VectorVest Simulator
- VectorVest Variator
- VectorVest Watchdog
