HOT TOPICS LIST
- MACD
- Fibonacci
- RSI
- Gann
- ADXR
- Stochastics
- Volume
- Triangles
- Futures
- Cycles
- Volatility
- ZIGZAG
- MESA
- Retracement
- Aroon
INDICATORS LIST
LIST OF TOPICS
PRINT THIS ARTICLE
by Andrew Hetherington
Juniper Networks (JNPR) is in the midst of confusion. There is a struggle between supply and demand with the supply side winning at this point.
Position: N/A
Andrew Hetherington
Classic Dow Theorist who trades as a pure technician, using pattern recognition.
PRINT THIS ARTICLE
CHART ANALYSIS
Juniper Networks (JNPR). . .What Is The Right Strategy?
08/19/04 08:38:26 AMby Andrew Hetherington
Juniper Networks (JNPR) is in the midst of confusion. There is a struggle between supply and demand with the supply side winning at this point.
Position: N/A
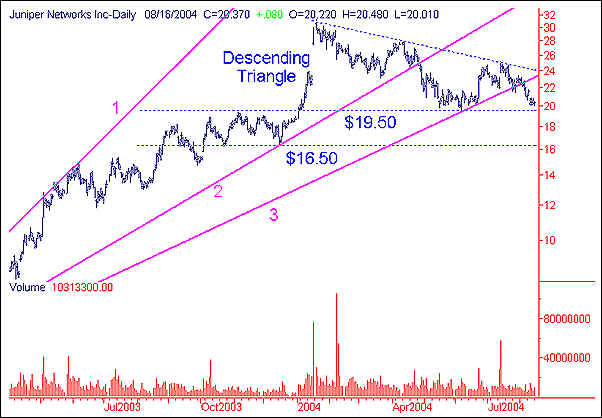
| The chart below shows a 10-month descending triangle near completion. Although still in the making, it looks as if it will drift up slightly higher to the supply line in the $23.00 - $24.00 area before dropping lower once again. It is no coincidence that at that area is the top of the triangle and the third fan line. The third fan line was broken in early August in the $22.50 area. |

|
| Figure 1: Daily chart of Juniper Networks. |
| Graphic provided by: SuperCharts. |
| |
| My suggestion is to wait for the inevitable pullback to the third fan line and take a short position. Anywhere in the $23.50 area is a very good entry point. The line at the top of the triangle is your bail out line. If this equity continues to climb higher above the $24.00 line then buy back the short at a small loss. The three percent rule applies on this line, meaning 3% above the line is the maximum allowable move against your position. The focus is on trying to short this equity as close to $24.00 as possible to minimize your risk and potential loss. |
| The next suggestion is to watch the supports on the way back down. These supports are at the $19.50 and $16.50 areas. The $19.50 is the breakout line for the bottom of the triangle. When it drifts lower towards this line it may need a day or two to drop through it. However, don't wait too long because the general market trend may switch from short to long in the 9600 or 9300 areas. Play with the general market trend. A hard drop through the breakout line is the day to buy back your short at a decent profit. |
Classic Dow Theorist who trades as a pure technician, using pattern recognition.
| Toronto, Canada |
Click here for more information about our publications!
Comments
Date: 08/19/04Rank: 5Comment:

|

Request Information From Our Sponsors
- StockCharts.com, Inc.
- Candle Patterns
- Candlestick Charting Explained
- Intermarket Technical Analysis
- John Murphy on Chart Analysis
- John Murphy's Chart Pattern Recognition
- John Murphy's Market Message
- MurphyExplainsMarketAnalysis-Intermarket Analysis
- MurphyExplainsMarketAnalysis-Visual Analysis
- StockCharts.com
- Technical Analysis of the Financial Markets
- The Visual Investor
- VectorVest, Inc.
- Executive Premier Workshop
- One-Day Options Course
- OptionsPro
- Retirement Income Workshop
- Sure-Fire Trading Systems (VectorVest, Inc.)
- Trading as a Business Workshop
- VectorVest 7 EOD
- VectorVest 7 RealTime/IntraDay
- VectorVest AutoTester
- VectorVest Educational Services
- VectorVest OnLine
- VectorVest Options Analyzer
- VectorVest ProGraphics v6.0
- VectorVest ProTrader 7
- VectorVest RealTime Derby Tool
- VectorVest Simulator
- VectorVest Variator
- VectorVest Watchdog
