HOT TOPICS LIST
- MACD
- Fibonacci
- RSI
- Gann
- ADXR
- Stochastics
- Volume
- Triangles
- Futures
- Cycles
- Volatility
- ZIGZAG
- MESA
- Retracement
- Aroon
INDICATORS LIST
LIST OF TOPICS
PRINT THIS ARTICLE
by Andrew Hetherington
The long and the short of it for Imclone.
Position: N/A
Andrew Hetherington
Classic Dow Theorist who trades as a pure technician, using pattern recognition.
PRINT THIS ARTICLE
CHART ANALYSIS
Imclone Systems (IMCL) From A Long-Term Perspective
08/16/04 10:37:41 AMby Andrew Hetherington
The long and the short of it for Imclone.
Position: N/A
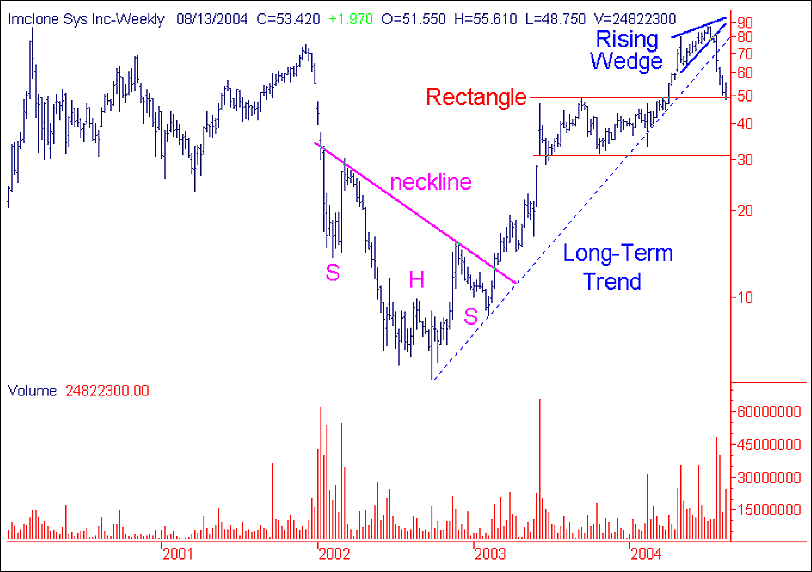
 Figure 1: Weekly chart of Imclone. Starting with the weekly chart, you will see that there are three patterns worth examining. First, there is the magnificently formed head and shoulders bottom reversal pattern occurring from January 2002 to February 2003. On February 7, 2003 it began a two-week breakout. This upward move took Imclone from the $9.00 area to almost $20.00. This breakout occurred on an increase in volume as is required and it also formed a pennant in the $14.00 area for a possible quick and reliable trade. |
| A meteoric rise to the $47.00 area occurred by early June after the necessary rectangle consolidation pattern formed. This pattern took nine months to form before it finally broke topside. The next up move went as high as $87.00 in five months. Inevitably, what goes up must come down. The bearish rising wedge formed and the fall from grace happened. |

|
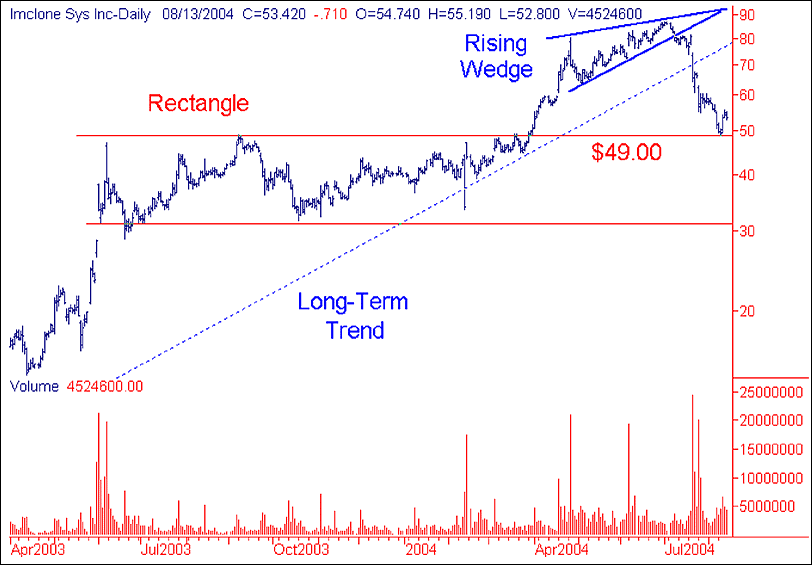
| Figure 2: Long-term view of Imclone's daily chart. |
| Graphic provided by: SuperCharts. |
| |
| All these patterns formed on excellent volume and all were accompanied with strong breakouts on high activity. From there, Imclone experienced a fast drop from the $87.00 area and went as low as $48.75, touching support in the $49.00 area. The next support is in the $32.00 area but this isn't likely to happen. The initial support of $49.00 held and a small pullback is inevitable at this point after such a fast drop. Anticipating a move upwards to the $60.00 - $65.00 is a reasonable prognostication, but don't forget that the long-term trend has been broken. The yellow caution flag is out for any long positions. In addition, the general market conditions are short and heading towards their lower support of 9600 on the Dow. If the 9600 supports don't hold then the next lower support is 9300. |
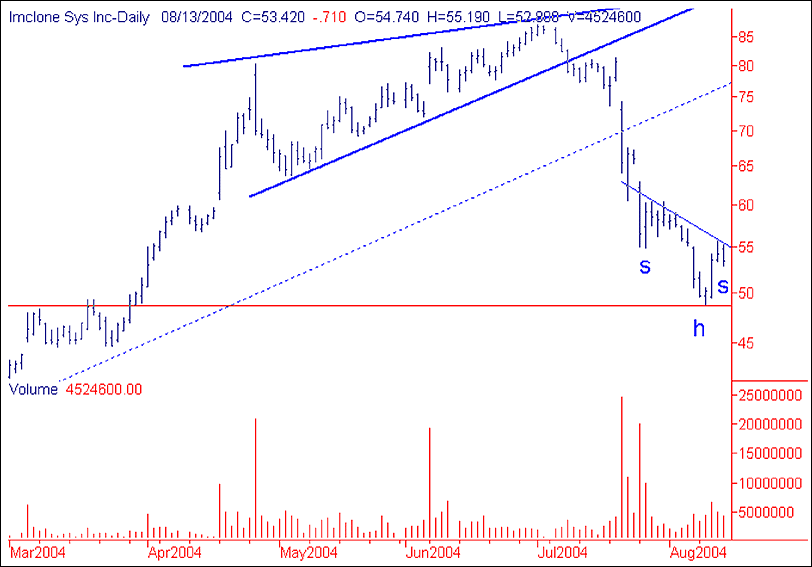
 Figure 3: Daily chart of Imclone. The short-term suggestion is to wait for the small, one-month head and shoulders to form if you want to trade it slightly upwards on this pullback, but be nimble since it won't stay up there for very long before dropping back down towards the lower supports. At this late stage of the game we have missed all the short opportunities that occurred in the $80.00 area. This was the optimum trade on this equity, so looking for better charts is a wise move. Trading it up on the pullback is risky and doesn't reward the trader enough for that potential risk. |
Classic Dow Theorist who trades as a pure technician, using pattern recognition.
| Toronto, Canada |
Click here for more information about our publications!
Comments
Date: 08/24/04Rank: 5Comment:

Request Information From Our Sponsors
- StockCharts.com, Inc.
- Candle Patterns
- Candlestick Charting Explained
- Intermarket Technical Analysis
- John Murphy on Chart Analysis
- John Murphy's Chart Pattern Recognition
- John Murphy's Market Message
- MurphyExplainsMarketAnalysis-Intermarket Analysis
- MurphyExplainsMarketAnalysis-Visual Analysis
- StockCharts.com
- Technical Analysis of the Financial Markets
- The Visual Investor
- VectorVest, Inc.
- Executive Premier Workshop
- One-Day Options Course
- OptionsPro
- Retirement Income Workshop
- Sure-Fire Trading Systems (VectorVest, Inc.)
- Trading as a Business Workshop
- VectorVest 7 EOD
- VectorVest 7 RealTime/IntraDay
- VectorVest AutoTester
- VectorVest Educational Services
- VectorVest OnLine
- VectorVest Options Analyzer
- VectorVest ProGraphics v6.0
- VectorVest ProTrader 7
- VectorVest RealTime Derby Tool
- VectorVest Simulator
- VectorVest Variator
- VectorVest Watchdog
